


Week of November 16, 2026
- Team invitations now open a dedicated page for existing users and expire after a week.
Fixes & tweaks
- Fixed the log volume graph flickering.
New features, improvements and fixes.
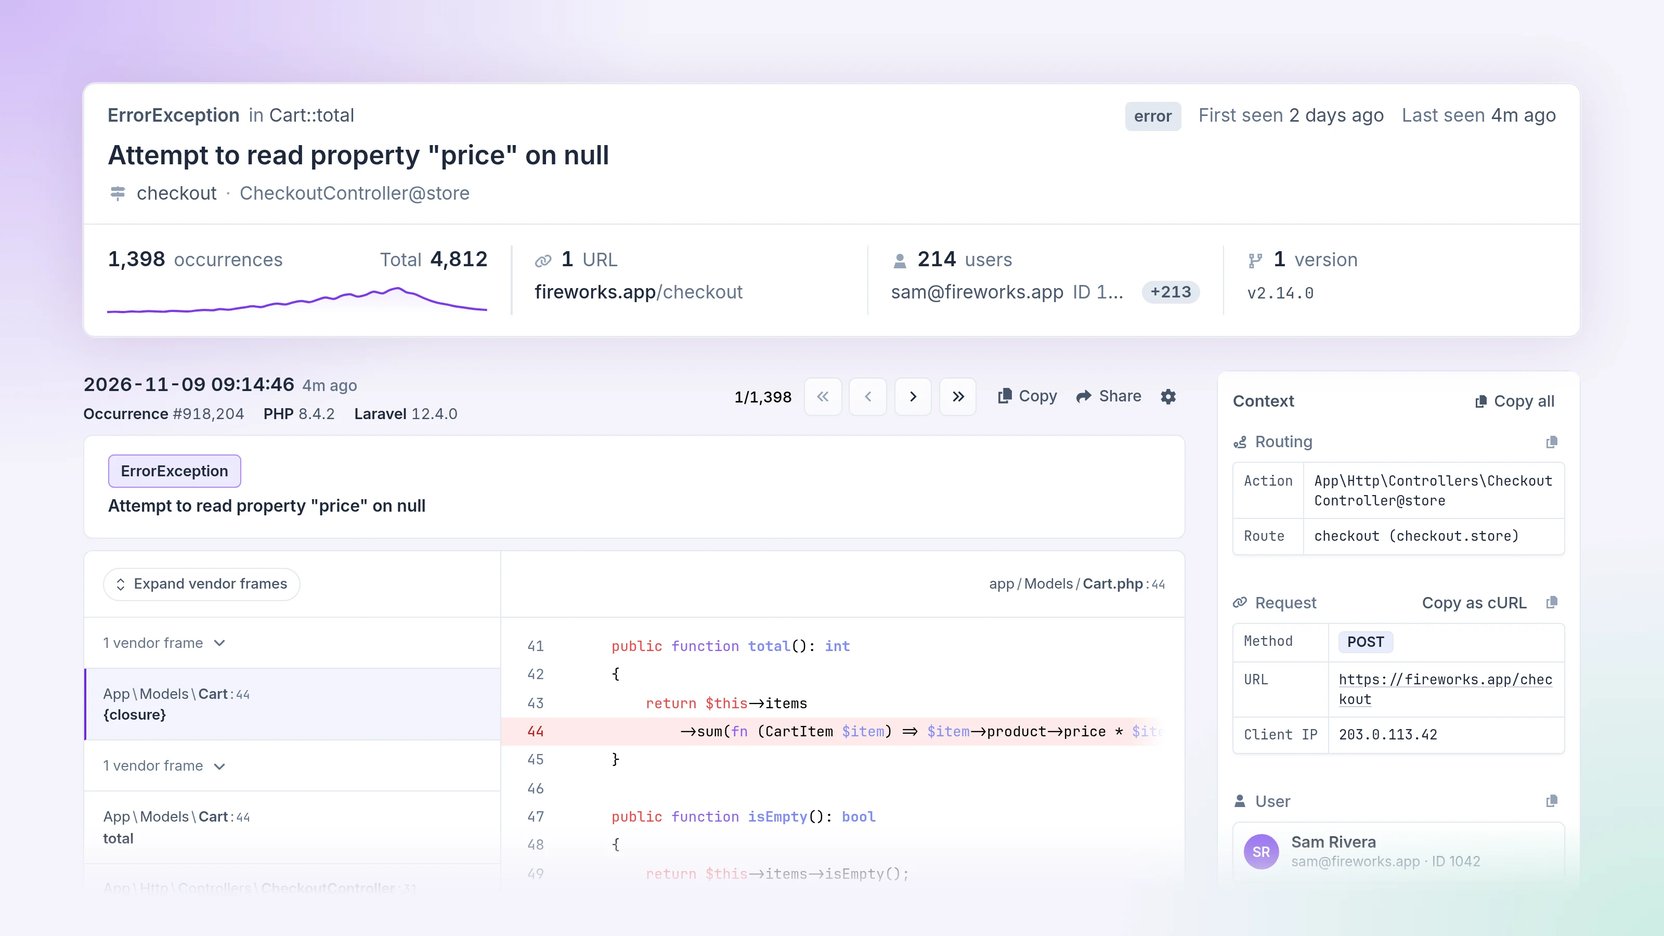
We've redesigned the errors list and error detail pages, from spotting an issue to investigating an individual occurrence.
The errors list brings occurrence trends and affected users into view. Open an error for a dedicated header with its stats and actions, occurrence navigation, and a two-column layout that keeps the stack trace and timeline alongside the request context. Resize the columns to give the details you're investigating more room.
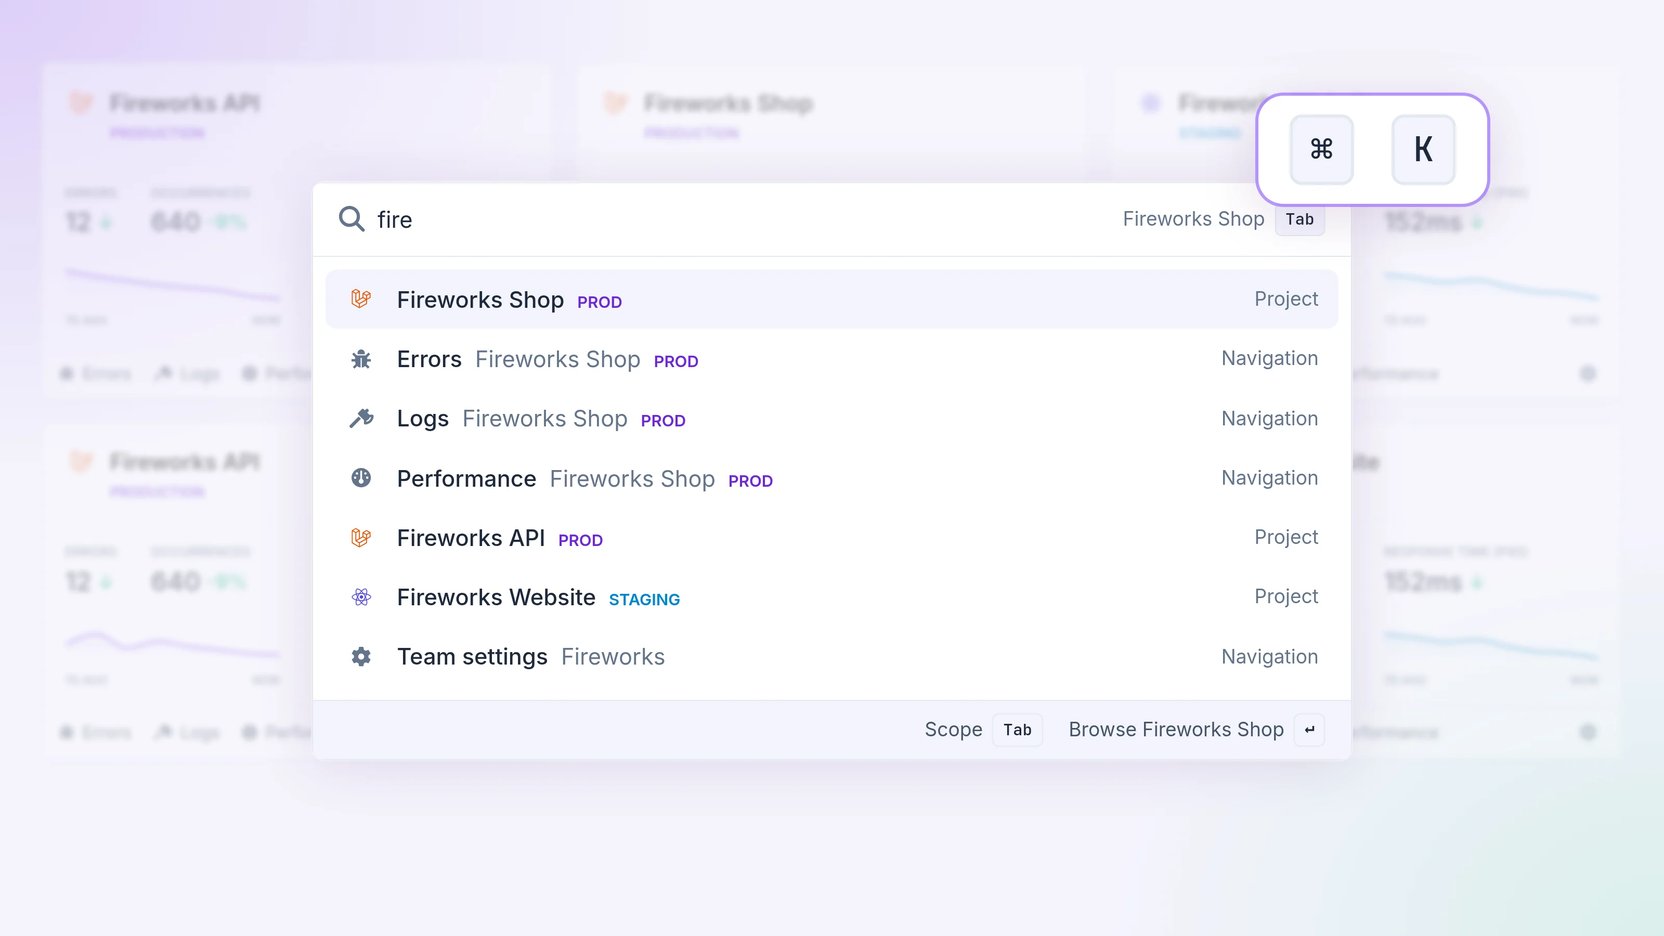
get_trace tool. It returns the spans of the trace with their attributes and events, so your AI tools can see why a request or job was slow.start_offset_ms and end_offset_ms for every span and offset_ms for every event, in milliseconds from the start of the trace, so you can see the exact timing between spans. The existing timestamps only show whole seconds.Press ⌘K, or Ctrl+K on Windows and Linux, to open the new launcher from anywhere in Flare. It replaces the project search with one place to jump to projects, their errors, logs and performance pages, or account, team and project settings.
Start typing to narrow the list, use the arrow keys to choose a result and press Enter to open it. You can switch projects or teams from the launcher too. Press the shortcut again to close it and return to what you were doing.
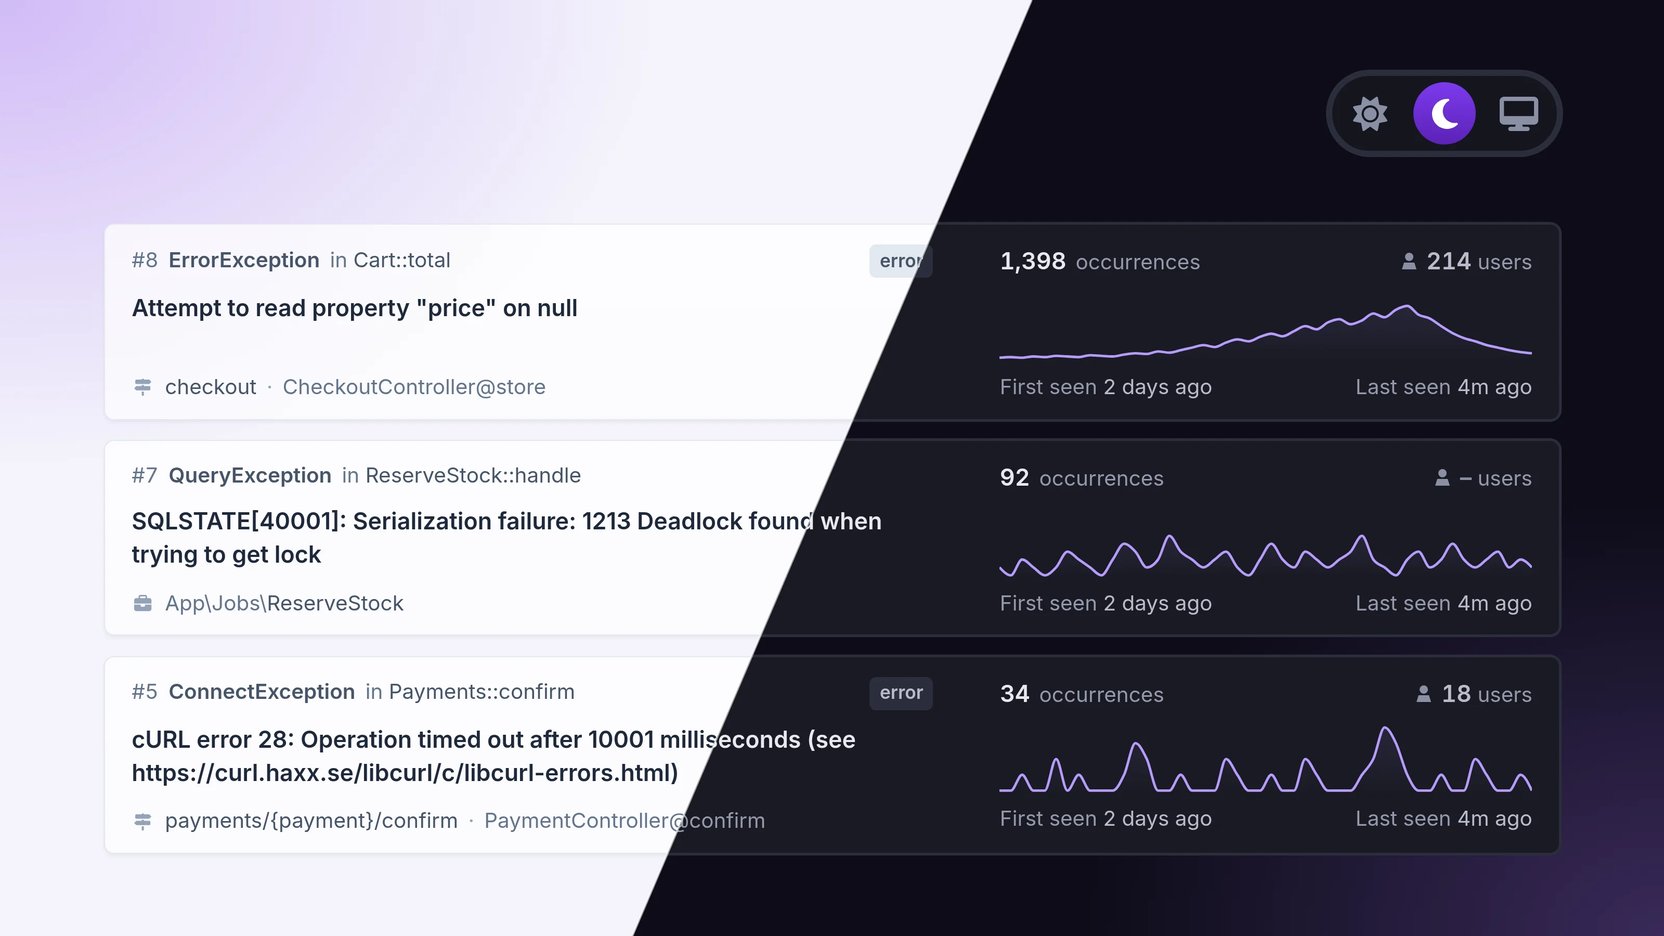
? to see what’s available.Flare now has a dark theme. Choose Light, Dark, or Match my system under Account → Appearance, or switch from your avatar menu. Your choice follows you across browsers; your account stays light until you choose otherwise.
Charts, log level colours, syntax highlighting, and stack traces all follow your theme, without a flash of the wrong theme when you open a page. Sign-in and marketing pages stay light for now.
The new Appearance page brings your theme and number format settings together. Every text and border colour in the dark theme meets the WCAG AA contrast minimum; the light theme keeps its existing colours.
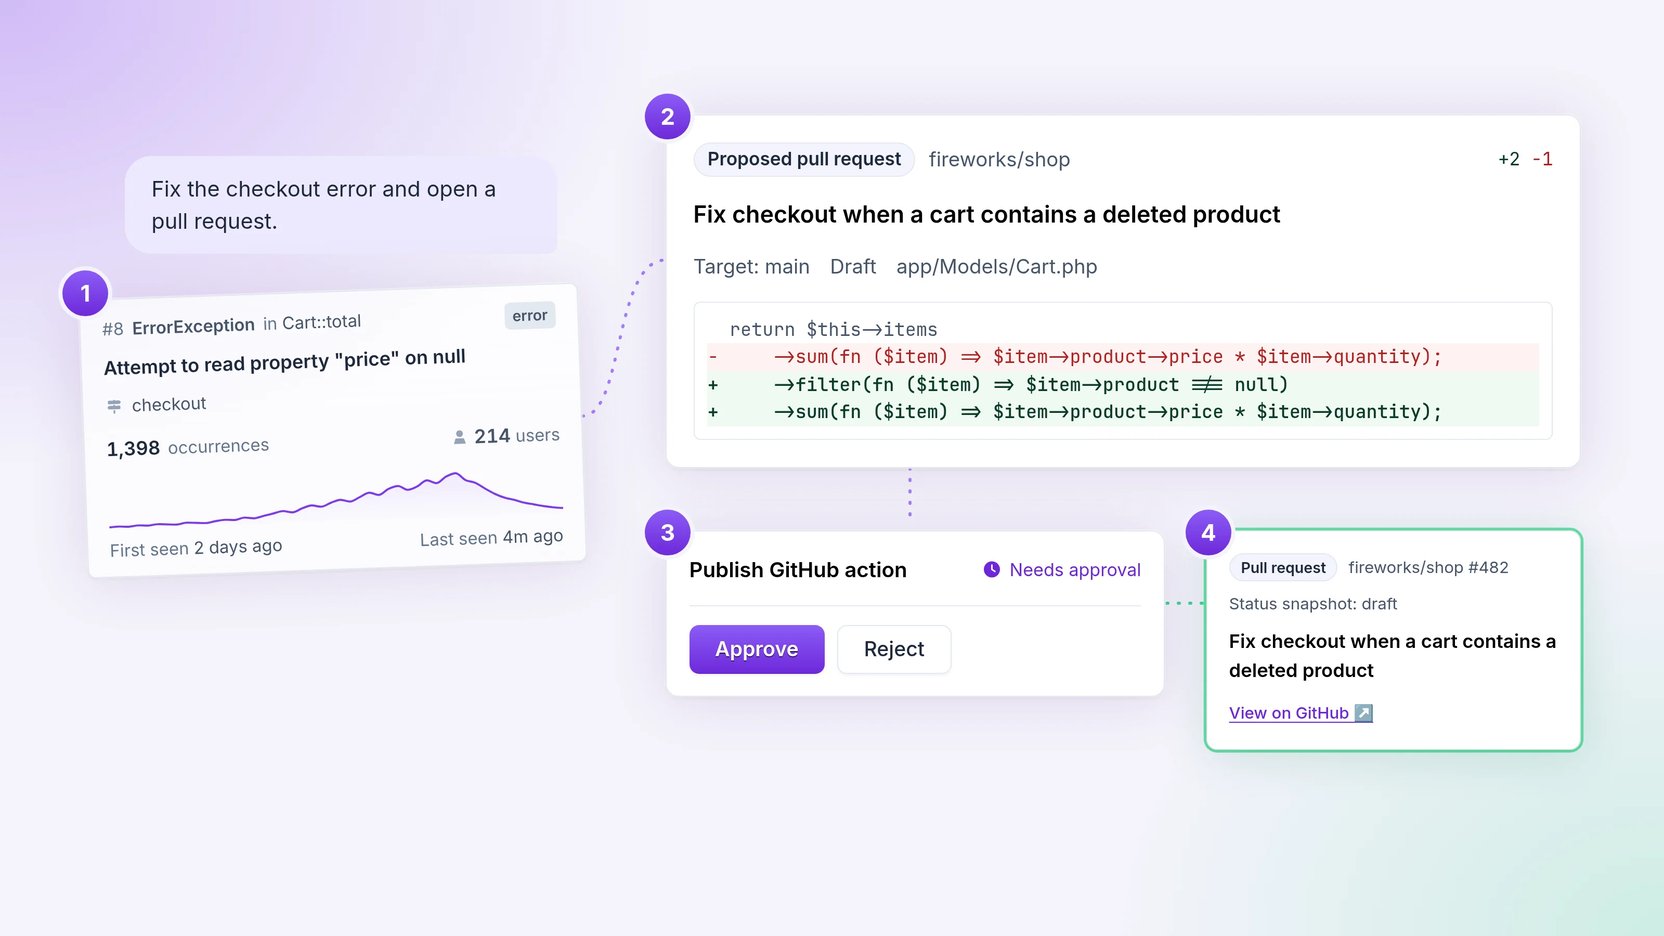
Ask the Flare assistant to help investigate errors, logs and performance data without leaving the app. It can also resolve, reopen, snooze, unsnooze and assign errors, add notes, or create projects after you approve the action.
With GitHub access enabled by a team admin, the assistant can read connected repositories for projects you can access and propose a pull request, issue or comment. Review the exact changes in the conversation before approving publication. GitHub access is off by default, and every write needs your approval.
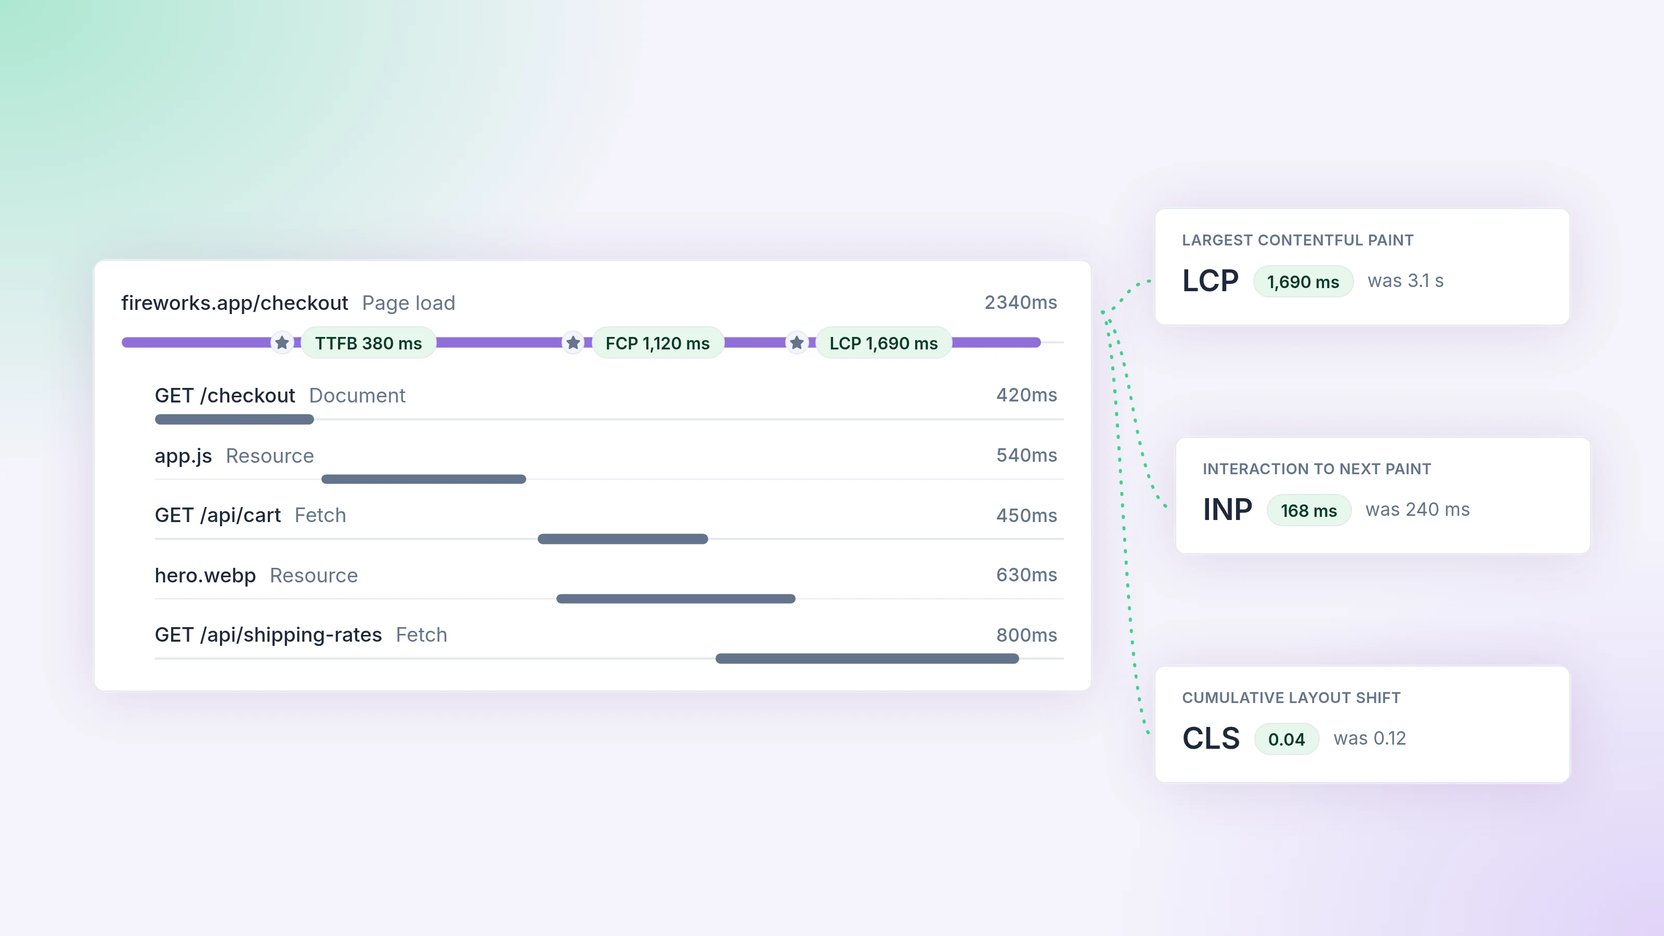
1,234.56, 1.234,56 or 1 234,56. Some screens used to follow your browser language instead, so the same number could look different from one page to the next.list_projects and the performance monitoring tools.list_* tool (list_routes, list_queries, list_jobs, list_commands, list_external_http, list_views, list_livewire_components, list_browser_pages) and a get_*_details drill-down with statistics, trend, time-series data, slowest traces, and related parent/child aggregations. These replace the previous list_slowest_routes, get_route_performance, and get_query_performance tools.Performance monitoring now reaches into the browser. JavaScript projects have a dedicated dashboard for pages and external HTTP requests, with Core Web Vitals to help you understand how your application feels to the people using it.
Open a page-load trace to see time to first byte, first contentful paint and largest contentful paint marked on the timeline. Select the page-load span for the full Web Vitals breakdown, including interaction to next paint and cumulative layout shift. Green, amber and red indicators put the measurements in context.
get_query_details tool with include_traces enabled. It always failed instead of returning traces.show_error_details tool now returns the error itself, with its status, assigned users, and the latest occurrence (including the stack trace) nested inside. search_errors results now list each error's assignees too.Route::metadata(). It appears in the Routing section of an error and in the Route panel of a trace span, with nested values rendered as JSON. (Requires the newest laravel-flare client.)Logging is now generally available on all plans. Stream Laravel and PHP logs to Flare in real time with full request context, filters, and search. Monthly log volume per plan: 1M (Hobby), 5M (Standard), 10M (Growth), 50M (Premium).
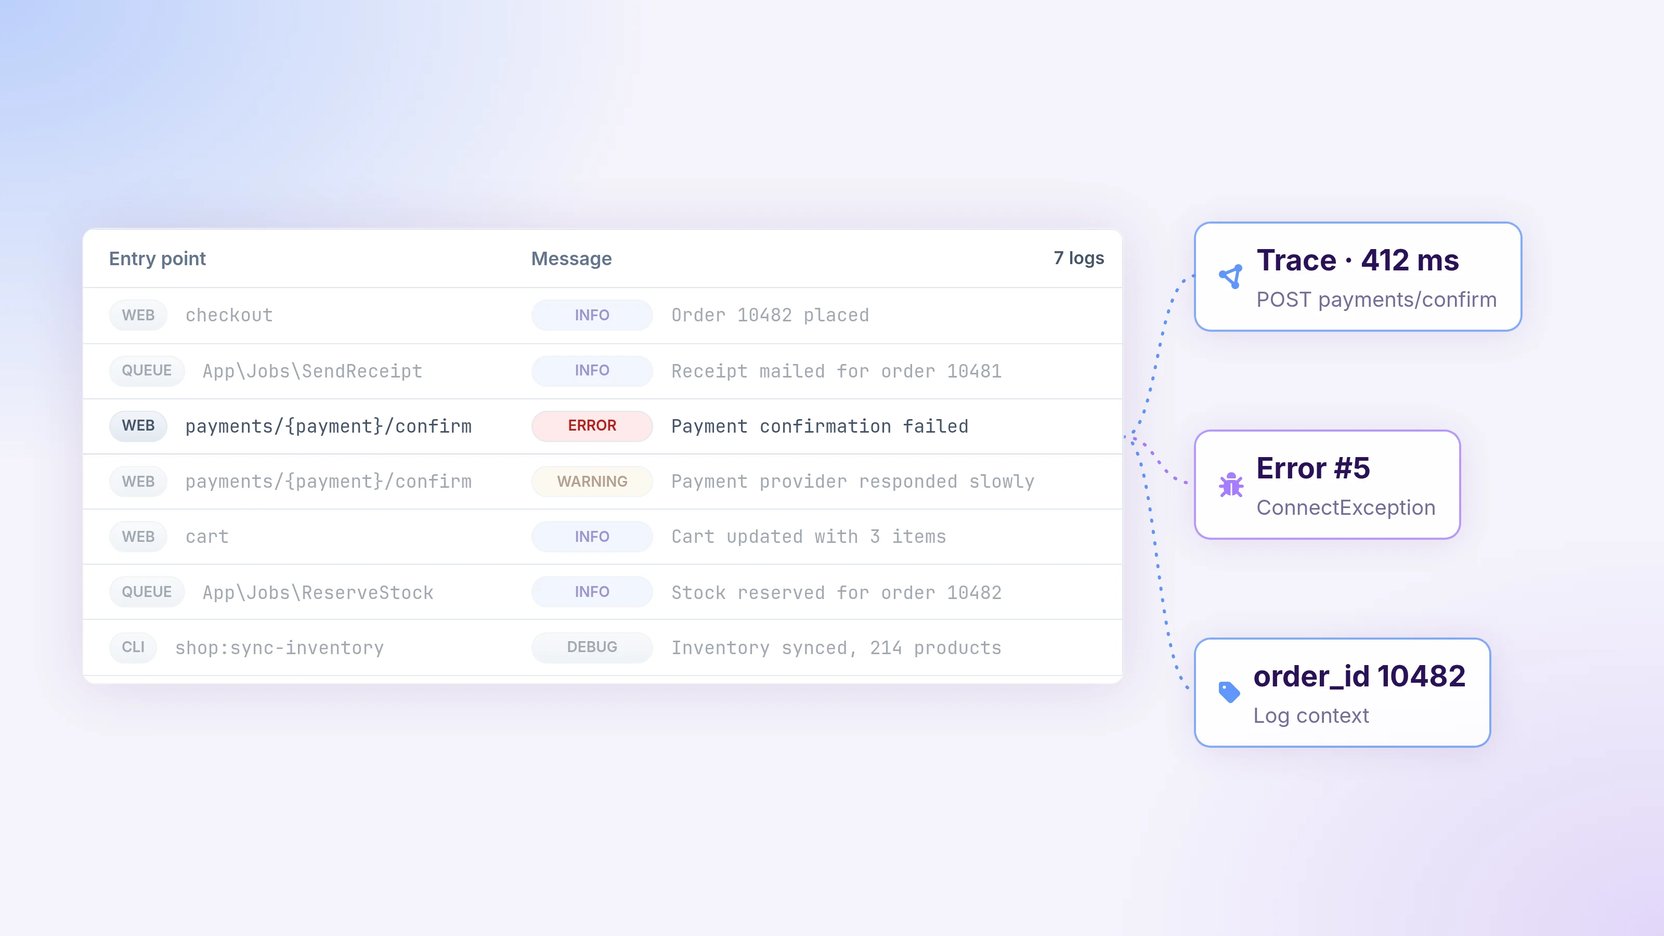
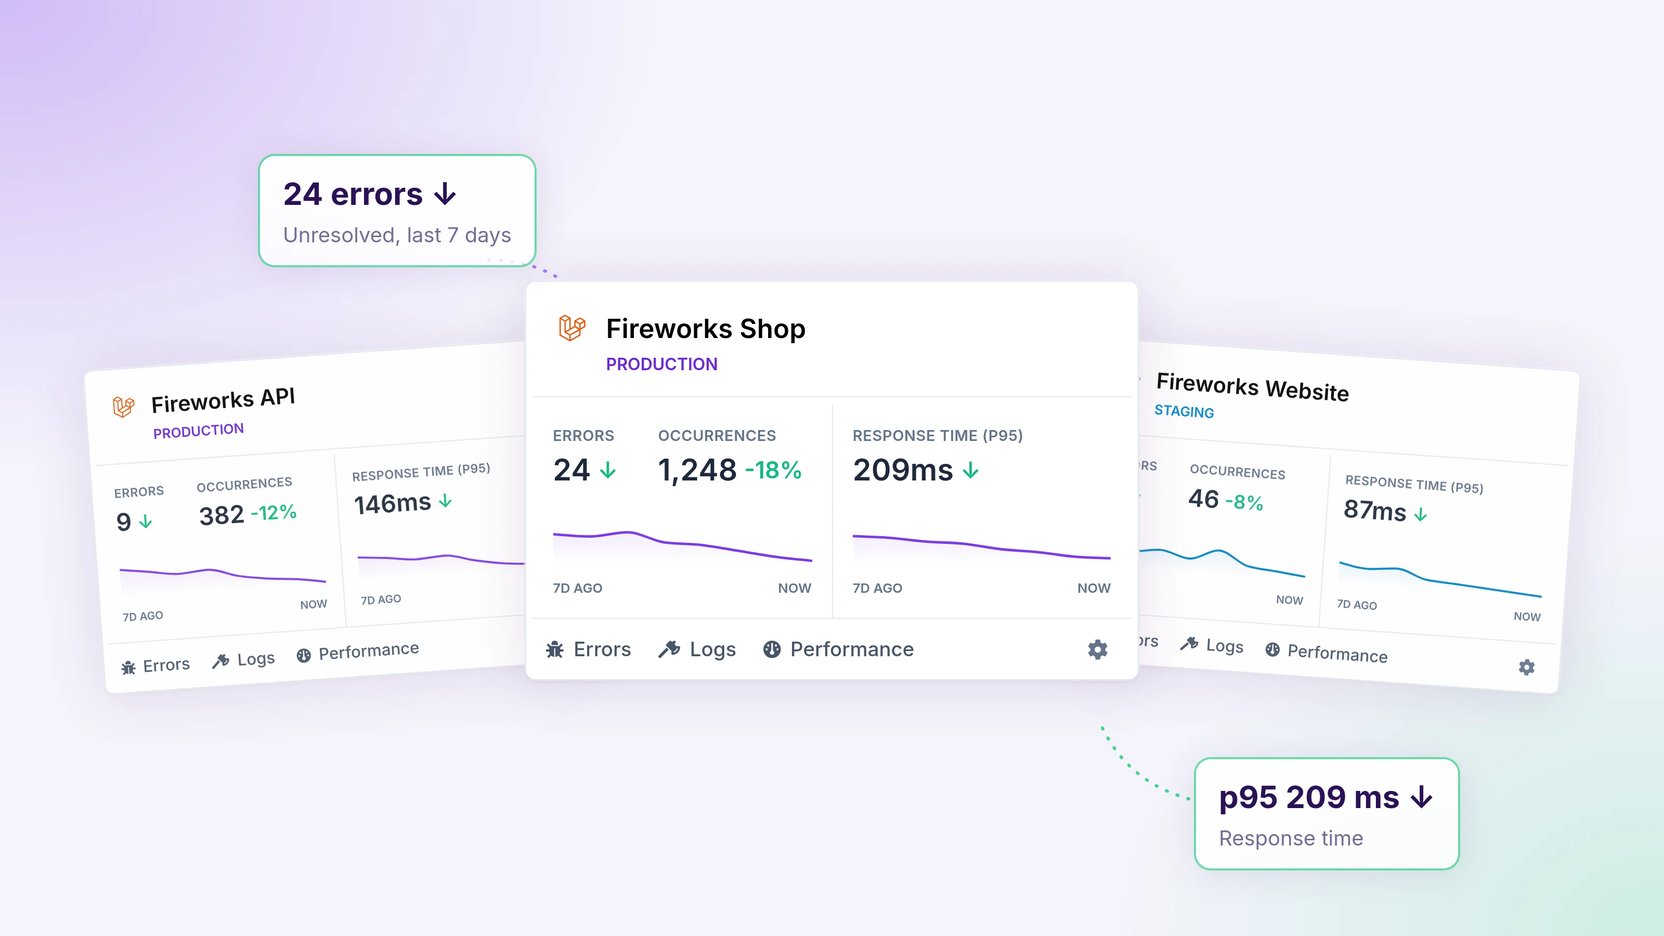
order parameter (asc or desc, default desc) so callers can control row ordering independently of cursor direction. Cursor pagination now uses cursor[direction]=before|after instead of the previous cursor[after]=0|1 boolean. The default response returns the newest logs first./work_items/123, in addition to the existing /issues/123 URLs.The projects overview has a new card-based layout. Each card brings together your unresolved error count, a seven-day occurrence sparkline and p95 response time, so you can spot which projects need attention without opening them one by one.
Trend indicators show how things are changing, and you can hover over the charts to explore the numbers. Your project's stage stays visible alongside its name, keeping production and staging easy to tell apart.
#, $, or parentheses2026-02-20T00:00:00Z)