


 Flare
Flare
 PHP
PHP
 JavaScript
 Protocol
Introduction
If you haven't turned on tracing yet, start with turn on tracing in the quick start. This page covers the React-specific half: timing your components. You can stop after the error reporting steps in the quick start and come back to this later. It isn't required to get errors into Flare.
Read more in how component profiling works, which explains what a mount span is and how it nests under a trace.
How React profiles a component
React has no automatic mode. You opt a component in by hand, by wrapping it in FlareProfiler:
import { FlareProfiler } from '@flareapp/react/profiler';

function ProductPage() {
    return (
        <FlareProfiler name="ProductPage">
            <Product />
        </FlareProfiler>
    );
}
name is required. It's the name the span gets in Flare. It doesn't have to match the component's own name, so pick something you'll recognize in a trace.
If you'd rather not change how a component is rendered where it's used, wrap it once with withFlareProfiler instead:
import { withFlareProfiler } from '@flareapp/react/profiler';

function ProductPage() {
    return <Product />;
}

export default withFlareProfiler(ProductPage, { name: 'ProductPage' });
Both forms record the same span. Use whichever fits how the component is already defined.
The options argument to withFlareProfiler is optional, and so is options.name. If you leave it out, the span is named after the component's displayName, then its function name, then falls back to 'Unknown' if neither is available, for example because the component was renamed by a minifier. Pass name explicitly if you want a stable, readable span name regardless of how the build minifies your code.
Which components are worth wrapping
Wrap the components you actually suspect are slow to mount, for example a page component, a component that does heavy work on mount, or one you're actively debugging. A trace stops recording new spans once it hits maxSpansPerTrace (1024 by default, see the configuration reference), so wrapping every component in a large tree can push the ones you care about past that limit. Add and remove FlareProfiler wrappers as you narrow down a problem, rather than leaving your whole tree wrapped.
What gets recorded
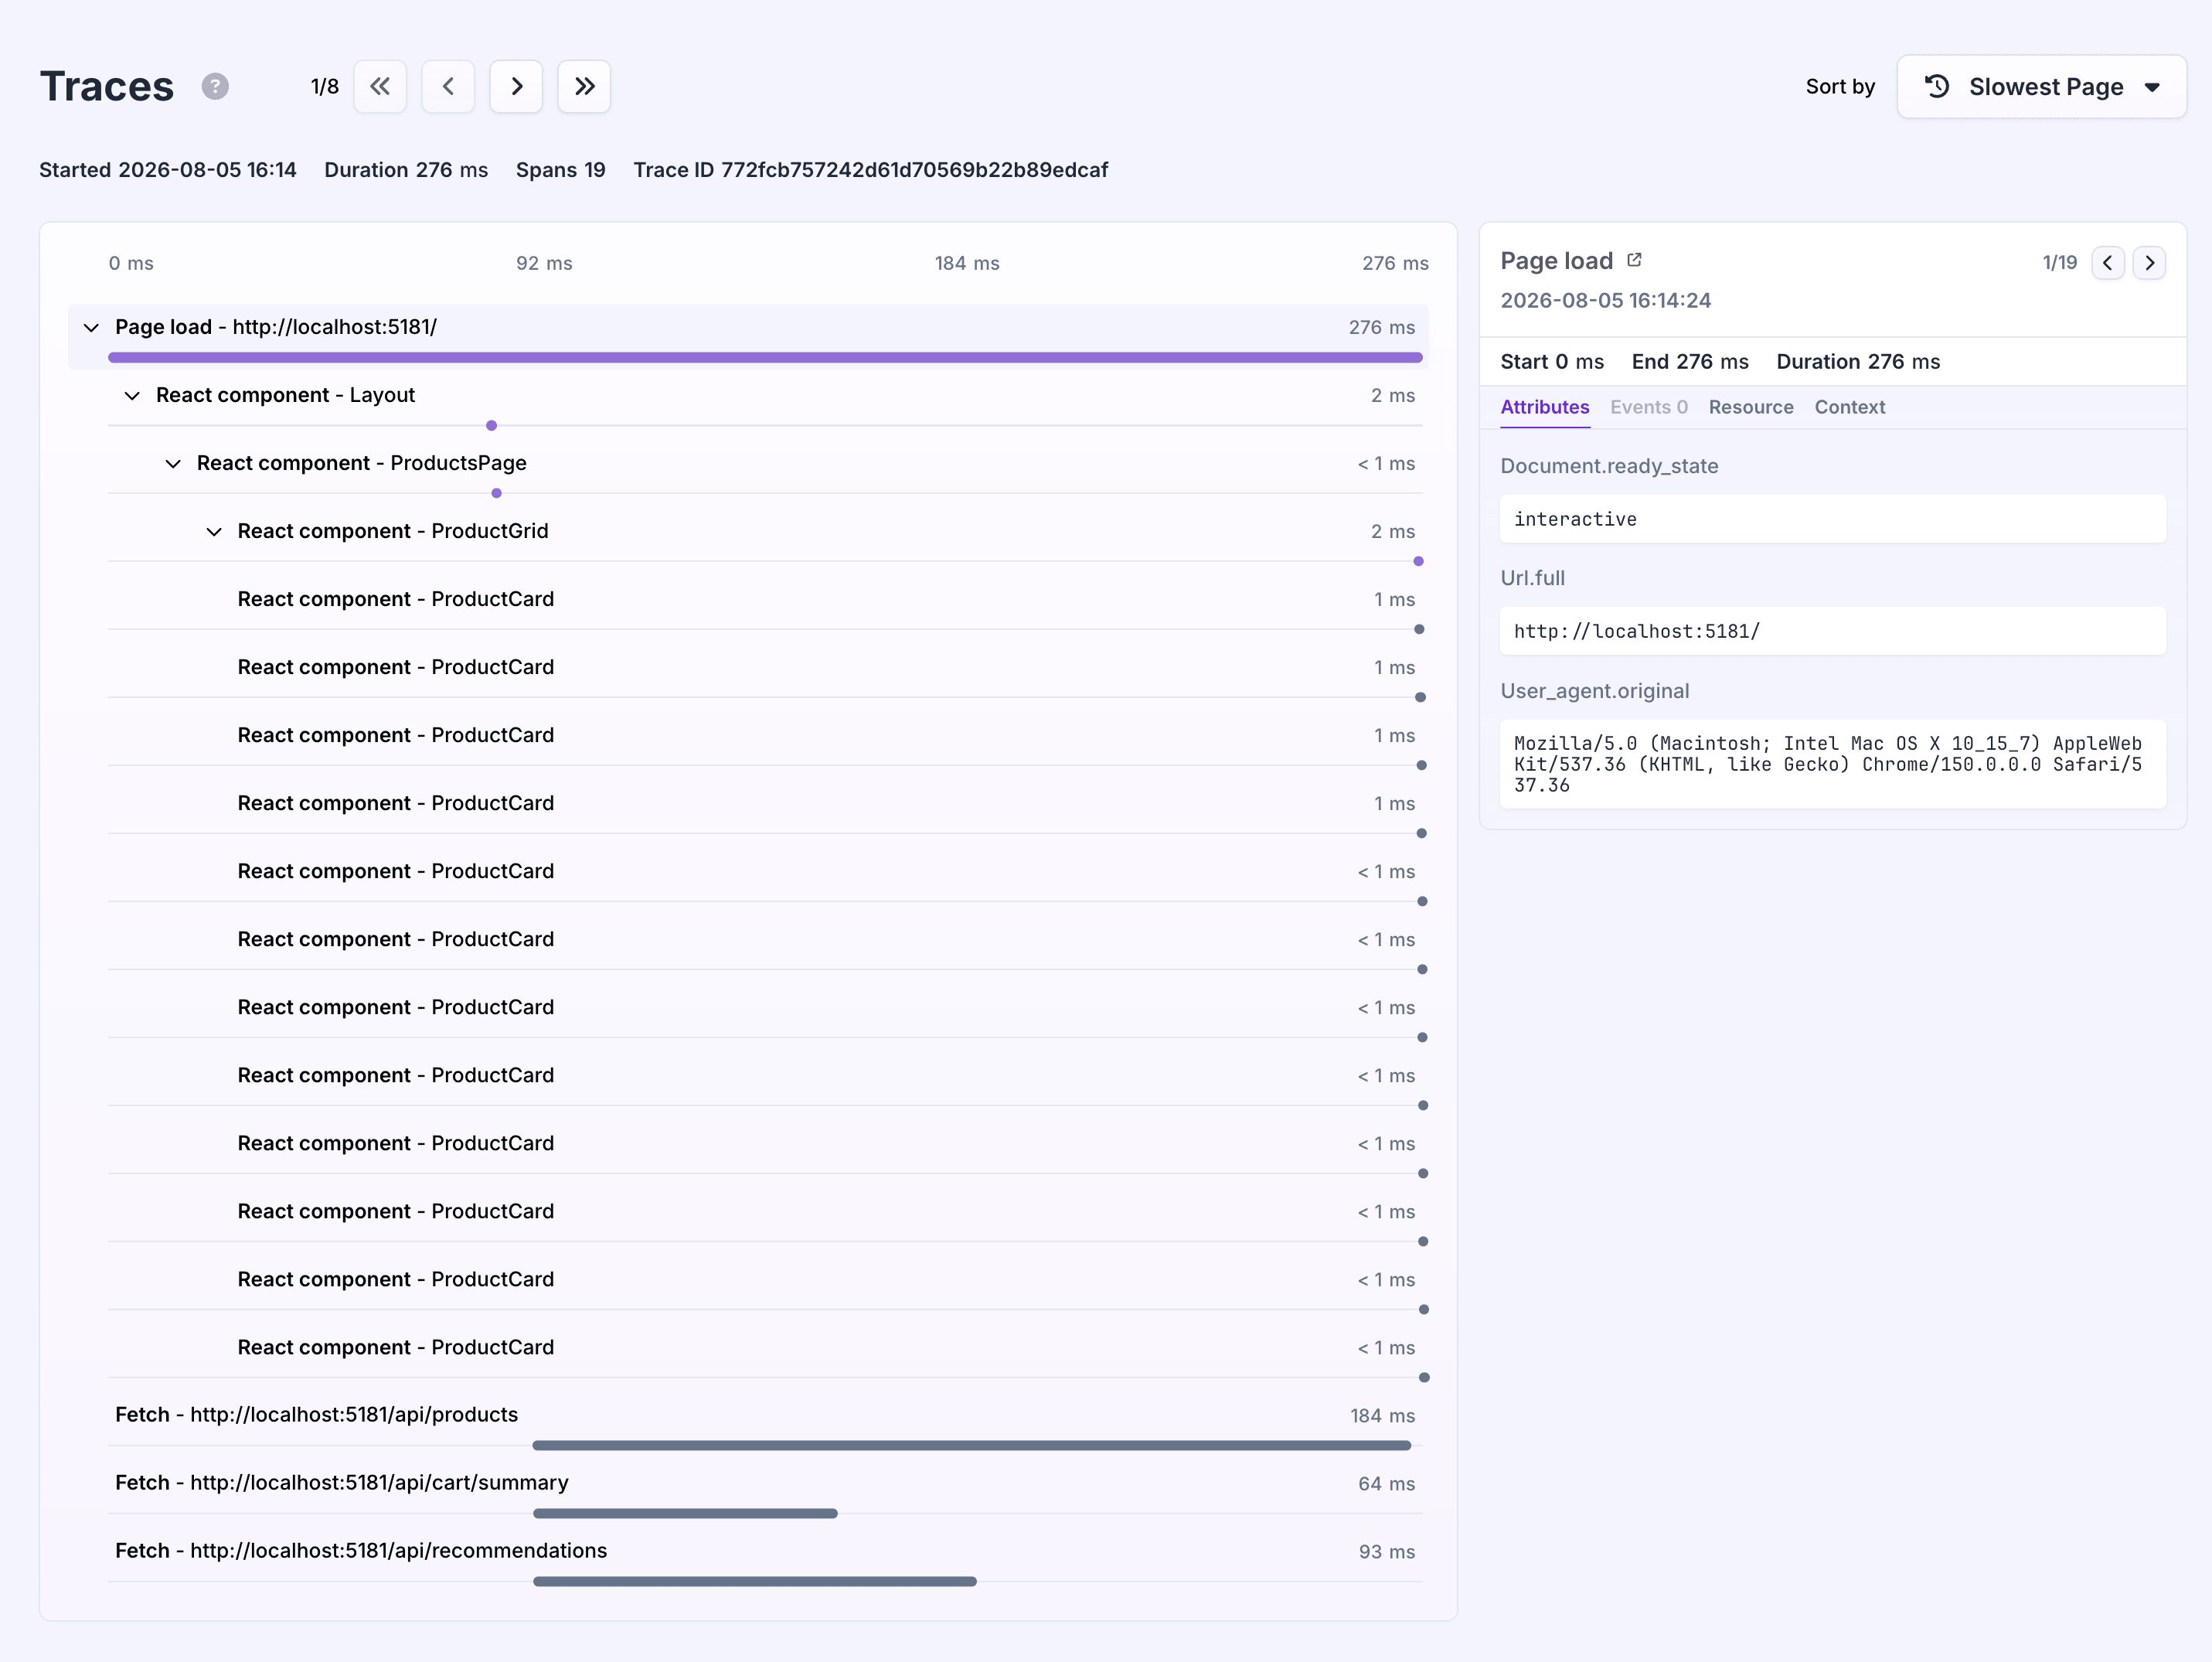
One span per wrapper, not one per component. FlareProfiler times the component you wrap it around. The components rendered inside it are not wrapped for you, so they get no span of their own. That single span does cover the whole subtree: it starts when FlareProfiler renders and ends once React has mounted everything inside it. Wrapping a large tree gives you one total for that tree, not a breakdown per component. Wrap the components inside it as well if you want to see where that time goes.
Only mounts. A FlareProfiler span covers the component mounting, once. Re-renders and updates after that are not recorded. If a component re-renders slowly after it has already mounted, this will not show you that.
Nested under the active trace. A mount span nests under whatever browser_pageload or browser_navigation span is open while the component mounts, and under any FlareProfiler ancestor that already started its own span. Wrapping a parent and a child both gives you a mount waterfall, not just two flat spans.
Only while enableTracing is on. Component profiling is part of tracing. With enableTracing off, FlareProfiler mounts your children as normal but no span is recorded.
Read more
- Tracing introduction for React: trace navigations with your router.
- How component profiling works: the shared ideas behind mount spans across frameworks.