


 Flare
Flare
 PHP
PHP
 JavaScript
 Protocol
How tracing works
Tracing shows you where time goes while your page loads and while it talks to your backend. This page explains the ideas behind it. For how to turn tracing on, see the quick start.
What a trace is
A trace is everything that happens during one piece of work, for example one page load. It groups together every timed operation that happened during that page load, from the load itself down to the individual requests it made.
What a span is
A span is one timed operation inside a trace. It has a name, a start time, and an end time. A page load is a span. A fetch() call your page makes is also a span.
How spans nest
A span can have a parent span. When a span has a parent, it means that span happened inside the timeframe of its parent. The page load span is usually the parent, and the fetch() calls your page makes while it loads are its children.
This parent-child relationship is what turns a flat list of spans into a tree. The span with no parent is the root of that tree, and it is also the root of the trace.
What a trace looks like for a browser page
Flare shows a trace as a waterfall. The root span is a bar at the top, and every child span is a shorter bar underneath it, positioned to show when it started and how long it took relative to its parent.
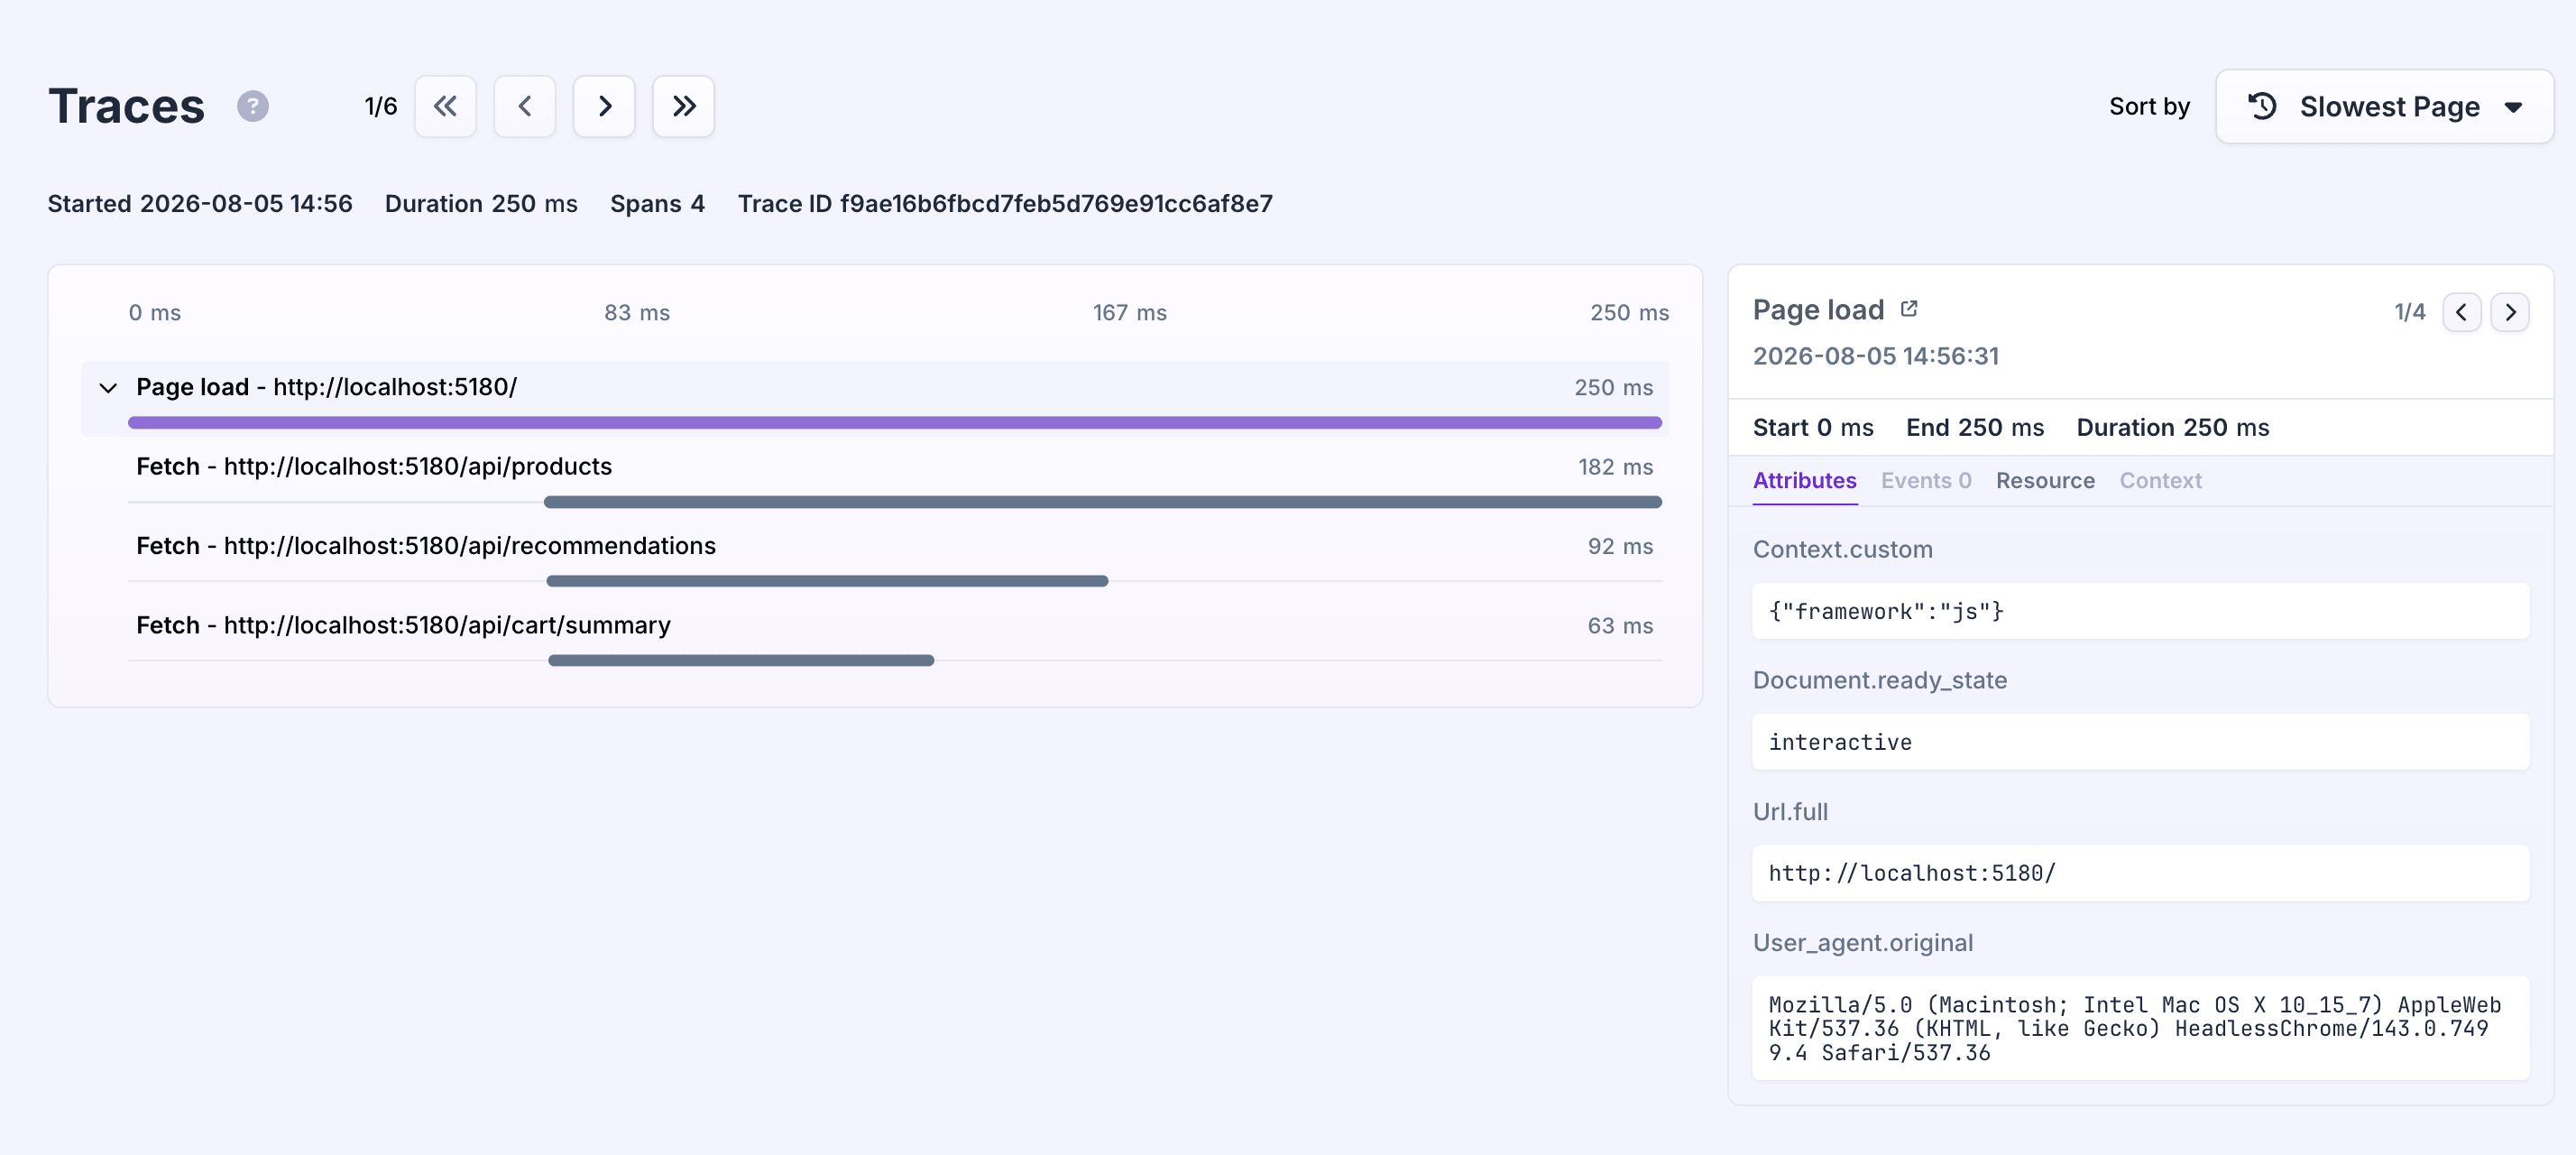
In the example above, the top bar is a browser_pageload span. The shorter bars underneath are browser_fetch spans for the requests the page made while it loaded. Read what gets traced for the full list of spans the client records for you.
Next steps
- What gets traced: the spans the client records automatically.
- Manual spans: time your own code.
- Sampling: control how many traces get sent.