


 Flare
Flare
 PHP
PHP
 JavaScript
 Protocol
How component profiling works
Component profiling times how long your components take to mount, and records each mount as a span inside a trace.
The @flareapp/js package does not do this on its own. It has no component lifecycle to hook into, so there is nothing for it to time. Component profiling comes from a framework package:
Each of those pages covers how you opt a component in, which works differently in every framework, and what that package records for you. This page covers the part they have in common: what a component span is, and where it ends up in a trace.
Timing your own code instead
You don't need a framework package to time part of your app. Wrap the code you want to time in a manual span:
import { flare } from '@flareapp/js';

flare.withSpan('render-product-gallery', () => renderProductGallery());
That span lands in the current trace the same way a component span does. You decide what it covers and what it is called, so you can time a render, a setup step, or any other piece of work you suspect is slow.
What a component span looks like in a trace
A component span nests under the page load or navigation span that was active while the component mounted. A whole page turns into a waterfall you can read from top to bottom.
This is what that looks like for a product page. The root is the navigation. Under it you see every component that mounted while the page rendered, together with the fetch calls the page made:
browser_navigation  /product/p07                   (139ms)
 ├─ ProductPage                                      (1ms)
 │   └─ AddToCartButton                             (<1ms)
 ├─ browser_fetch  /api/products/p07               (130ms)
 └─ browser_fetch  /api/recommendations            (100ms)
A waterfall like this shows you where the time went. The two fetch calls take almost all of the 139ms. Both components mount in about one millisecond. So on this page the problem is the data loading, not the rendering. A slow component looks the same: a wide bar, with the components it rendered nested inside it.
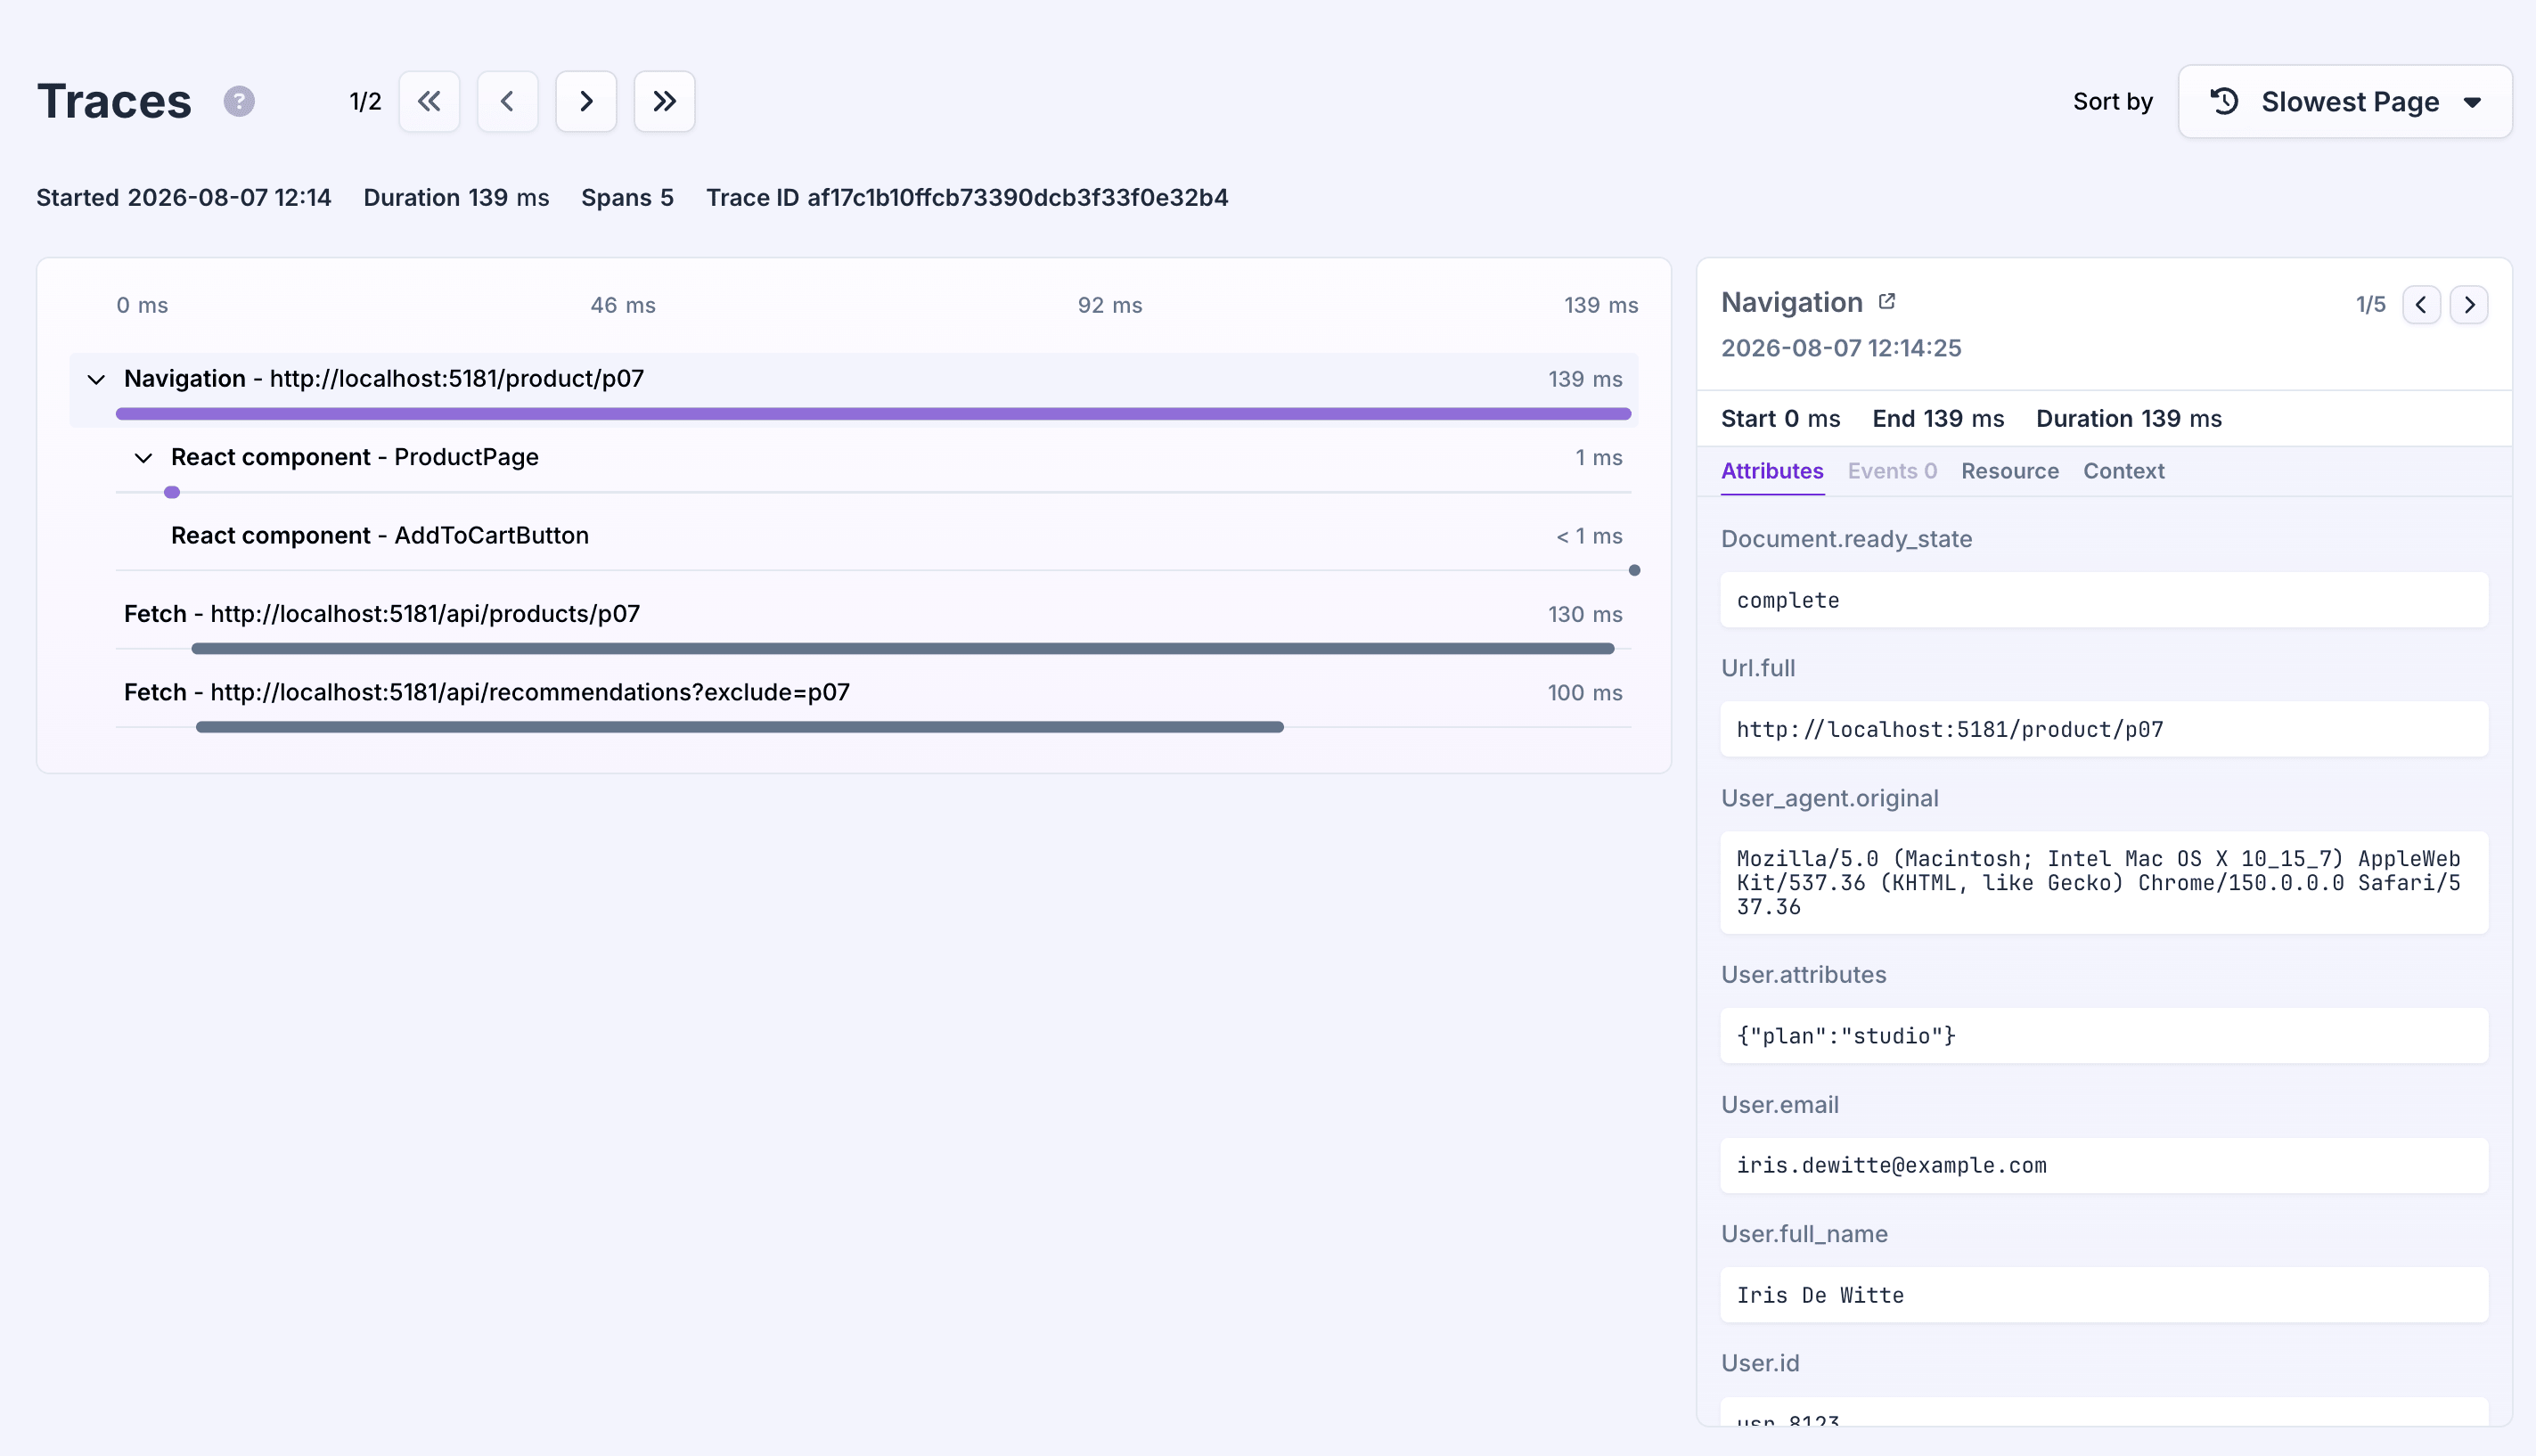
A component span nests under a trace root the same way any other span does. See how tracing works if you want the general idea behind spans and traces first.
Before you turn it on
It needs enableTracing. Component profiling is part of tracing. With enableTracing off, no spans are recorded for anything, including component mounts. See the configuration reference for enableTracing and the other tracing options.
Profiling every component is a debugging aid, not something to ship. Some framework packages can profile every component they see at once, which is useful while you're looking for a slow component locally. A trace stops recording new spans once it hits maxSpansPerTrace (1024 by default), and a real page can easily mount more components than that. The spans you actually care about can end up past that limit, alongside spans for components you were never trying to time. Name the components you want to profile instead, and add or remove entries as you narrow down a problem.