Blog
Announcing performance monitoring for JavaScript applications
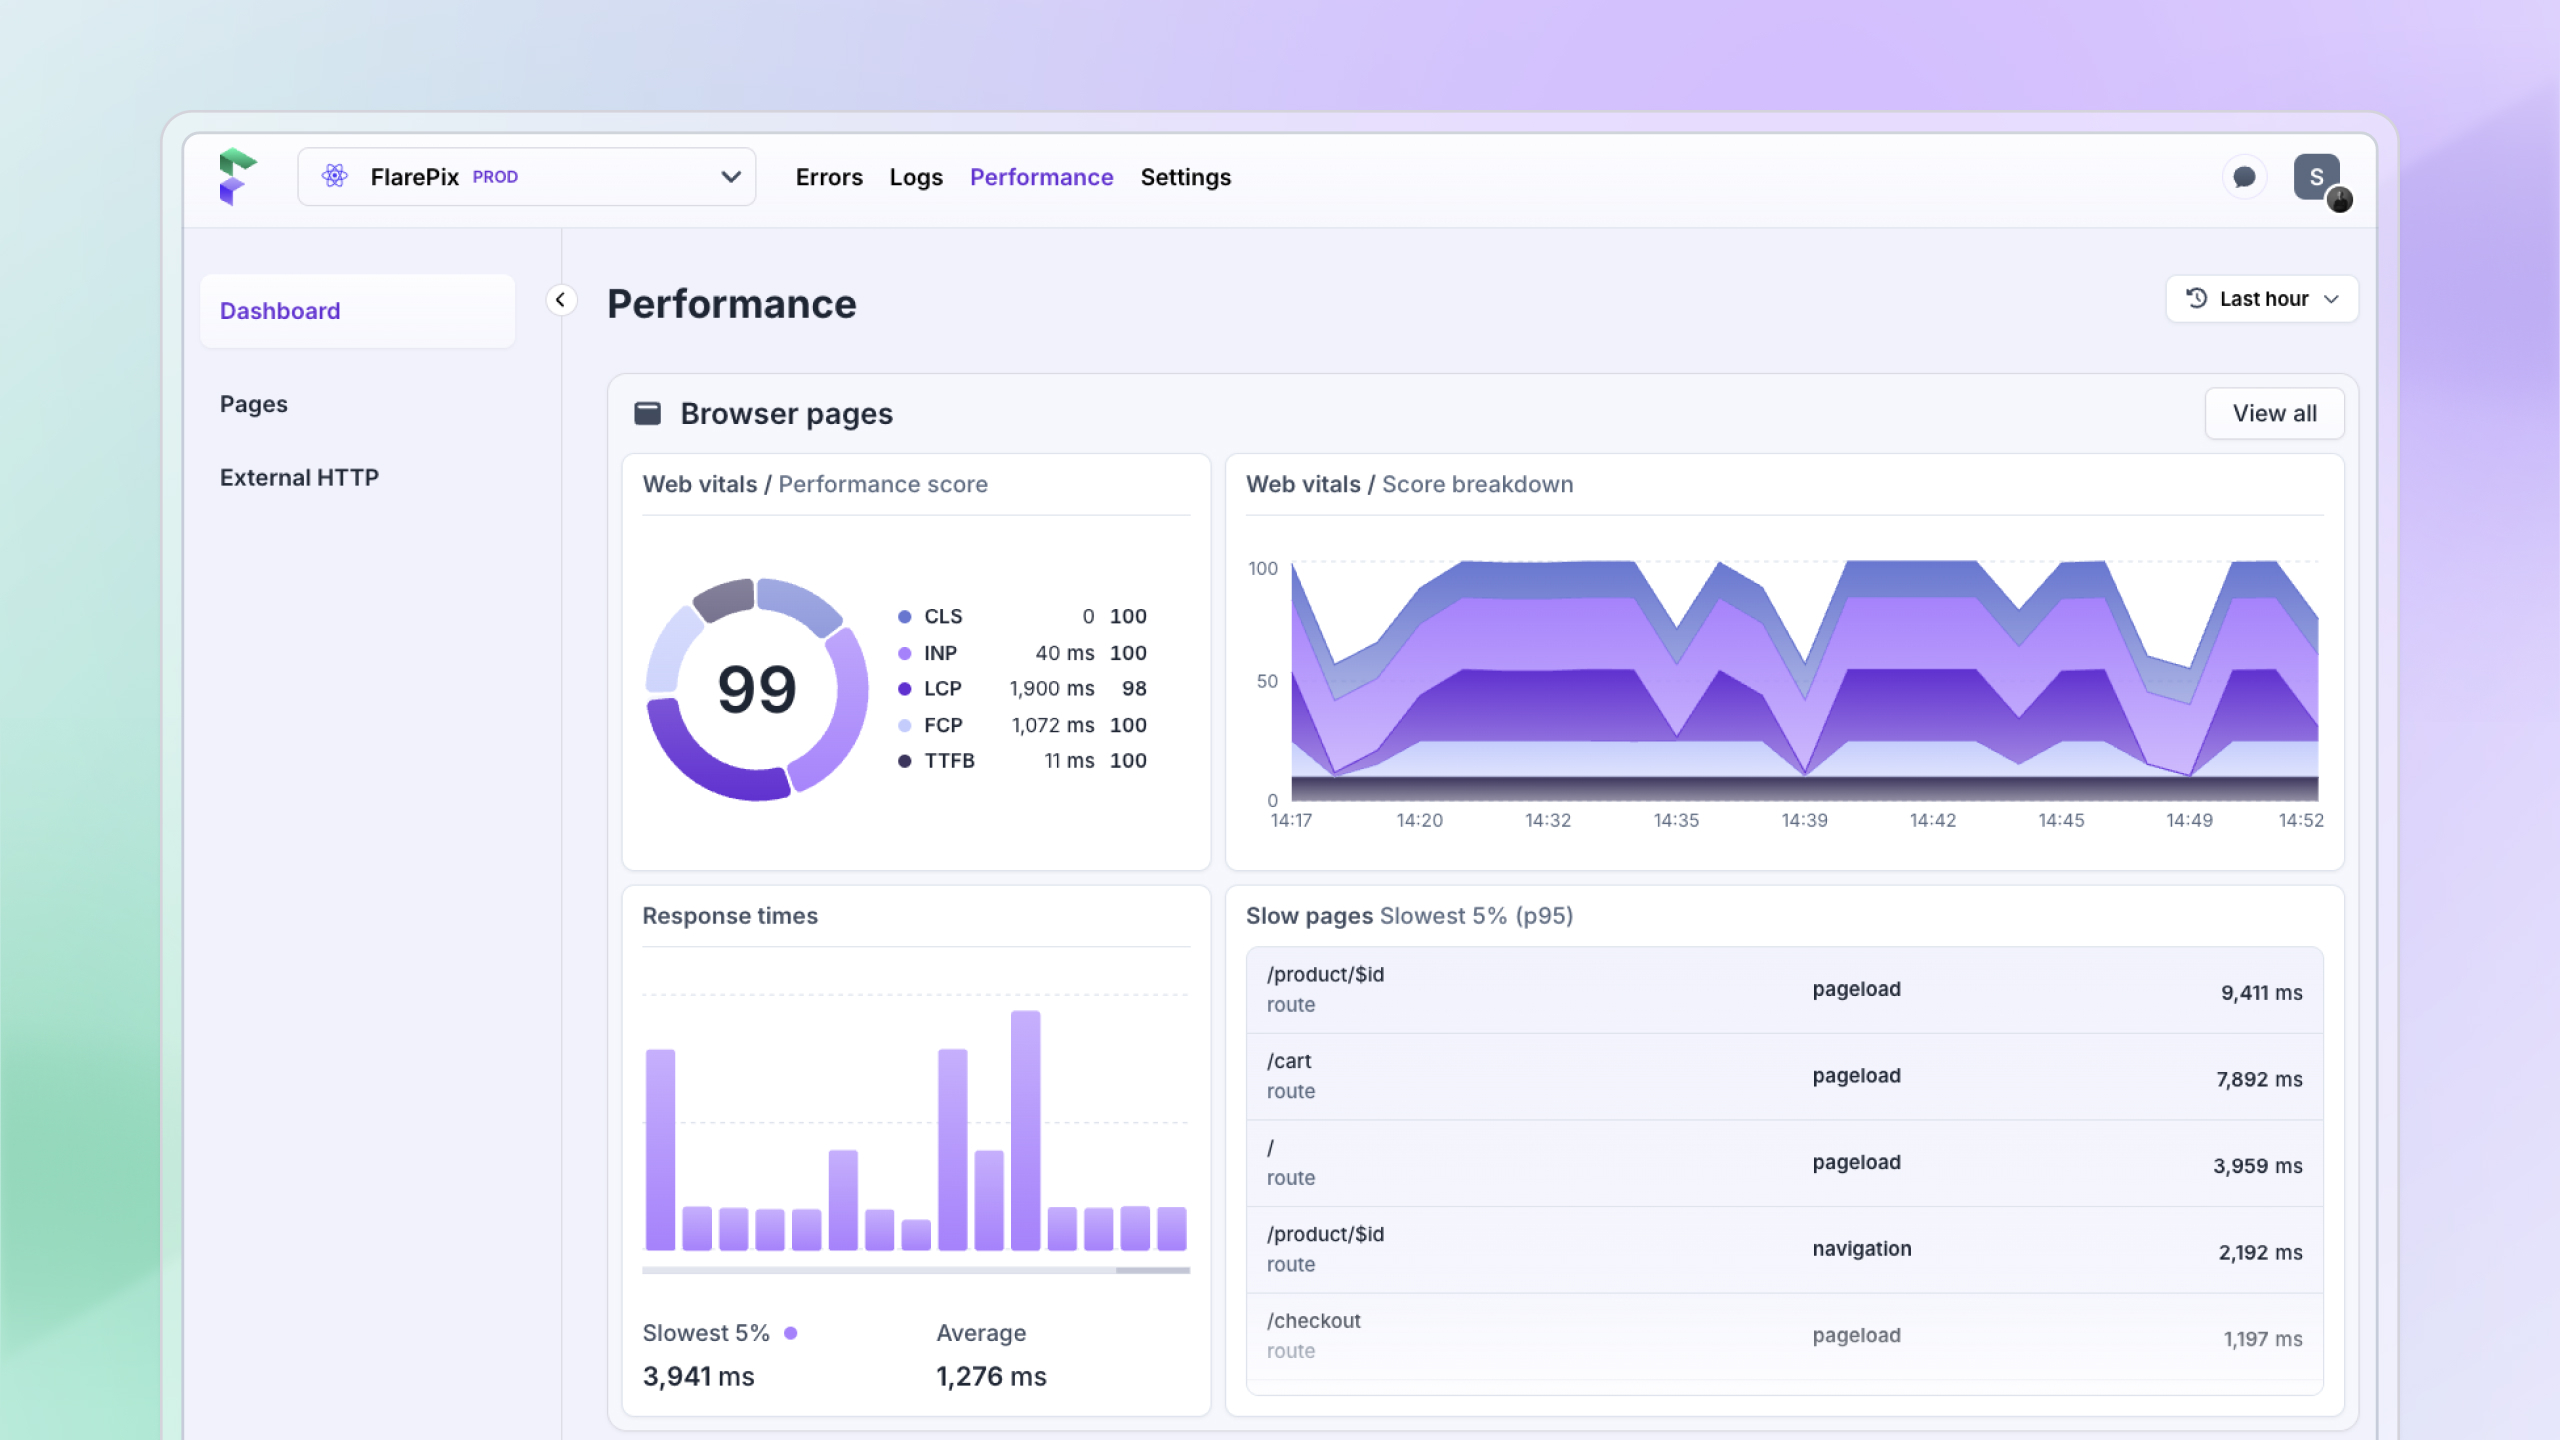
Until now, performance monitoring in Flare was a Laravel and PHP feature. Today we are releasing it for your JavaScript applications too.
If you already use @flareapp/js for error tracking, enabling performance monitoring is just two lines of config:
flare.configure({
    enableTracing: true,
    tracesSampleRate: 0.1,
});
From there the client records page loads, client side navigations, and every fetch and XMLHttpRequest your page fires.
Core Web Vitals from your real visitors
A page load also includes the five Core Web Vitals in the trace: TTFB, FCP, LCP, INP and CLS.
Google measures these numbers too. PageSpeed Insights runs Lighthouse on a simulated device with a throttled connection, and next to that it shows you field data from the Chrome UX Report. That field data has three blind spots: it only comes from Chrome on desktop and Chrome on Android, so no Safari, and no Firefox. Your page also needs enough traffic to clear a minimum number of visitors. And it has to be publicly discoverable, so anything behind a login is invisible.
In Flare you get the numbers from everyone who actually uses your web app, on the browser and the device they actually have. That includes the quiet pages and everything behind your login screen.
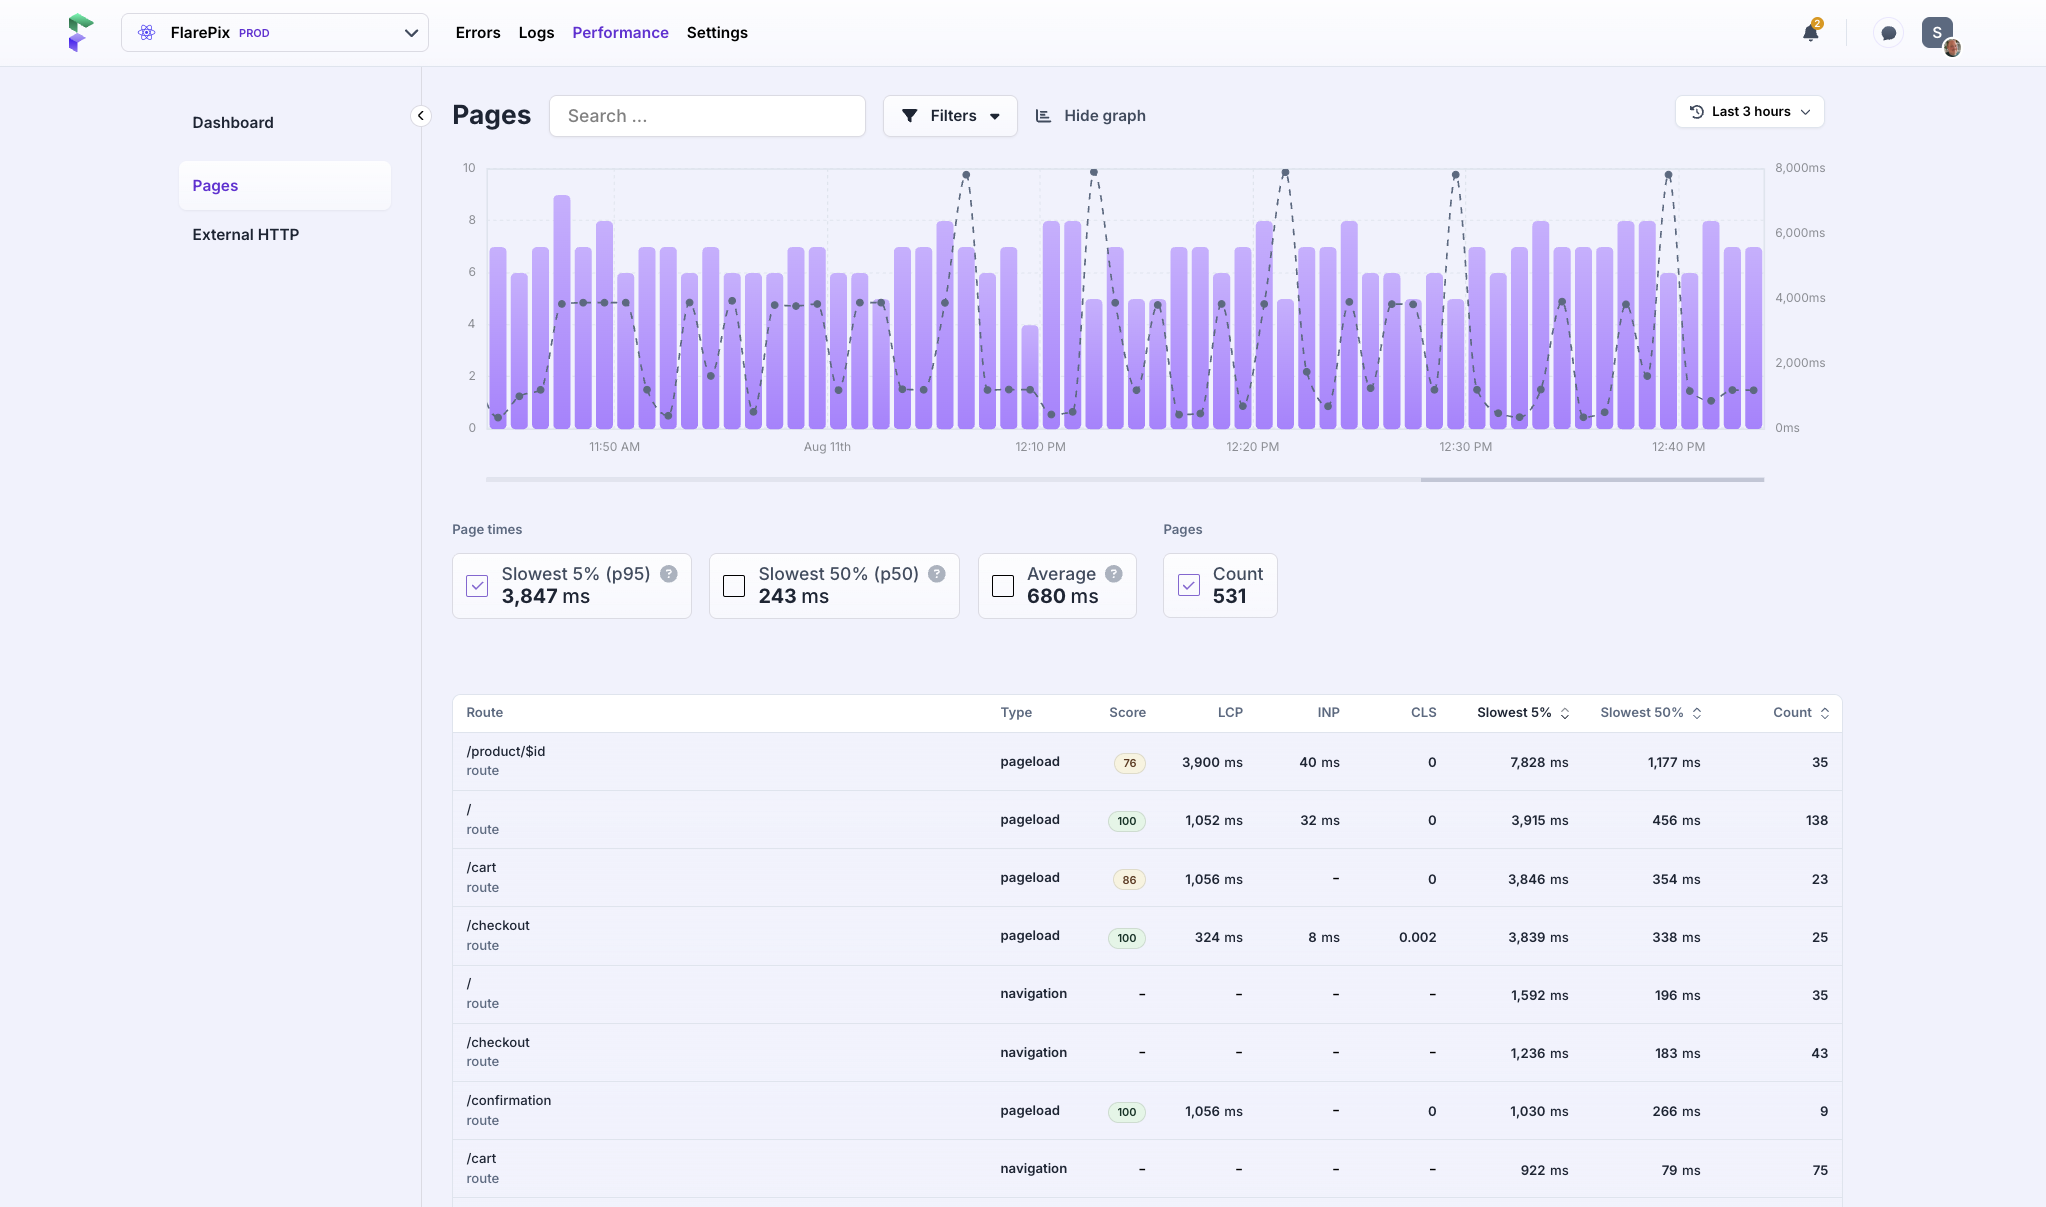
The values you see are p75 (the 75th percentile, meaning what 75% of your users experienced for that page). It's the same percentile Google uses to judge a page. We are not using averages, because that would hide your slowest page loads behind the fastest ones.
We also calculate a score out of 100 from the five vitals, so you can quickly see which pages are underperforming. It works like the Lighthouse score, but it is not the same number: Lighthouse scores lab metrics like total blocking time, while ours is built on the five vitals your visitors produced. Dive into a trace to see what's actually taking up all the time.
The trace of a single page load
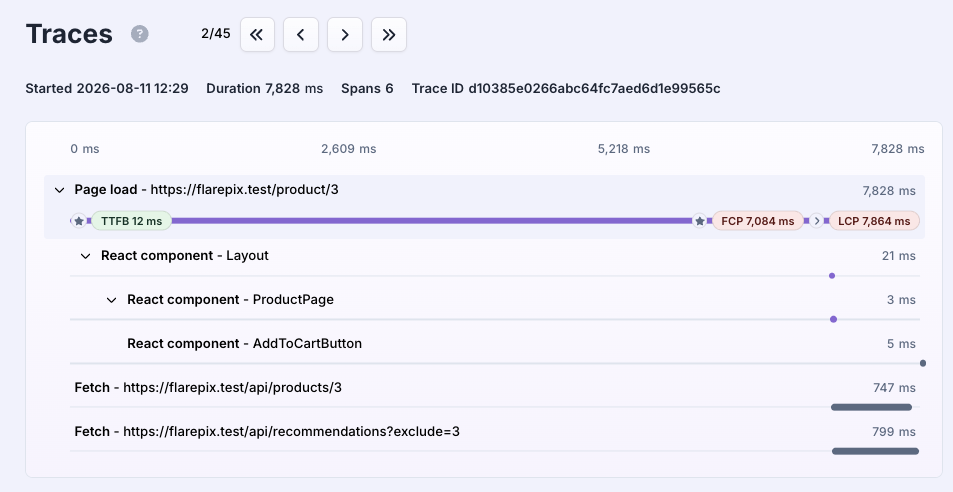
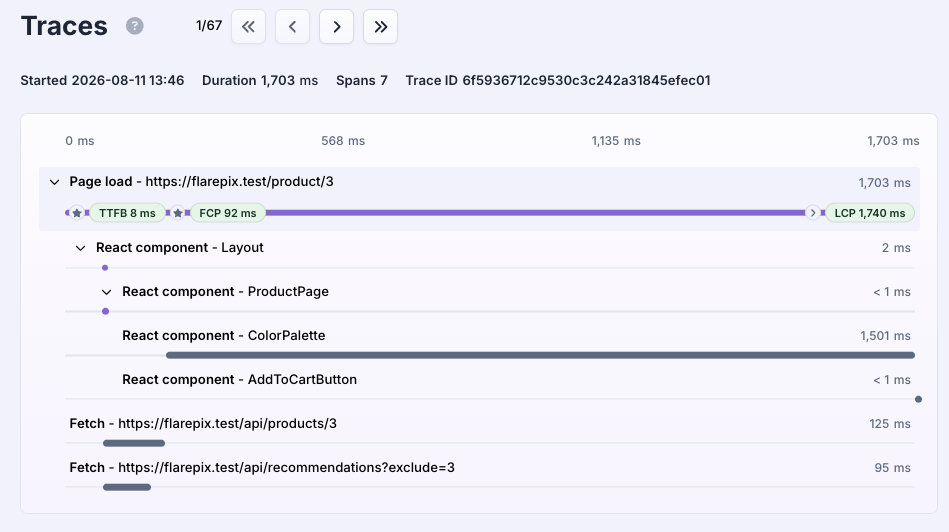
Traces show you a waterfall of spans for a single visit, with TTFB, FCP and LCP sitting on the page load span at the moment they happened.
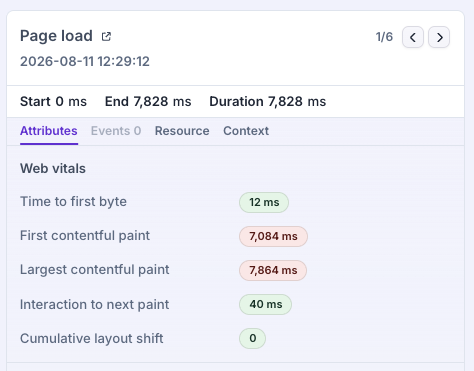
In the sidepanel next to the trace we've added a dedicated spot for the five web vitals in full.
Component profiling
A slow page is either waiting on data or busy rendering, and those need very different fixes. Our JavaScript client can time how long it takes for React, Vue and Svelte components to mount. Use the trace viewer to quickly diagnose the slowest components on your pages. Take a look at our documentation for more info about the profiler.
Framework specific router integrations
With plain JavaScript there is no router for us to read a route pattern from, so we can not collapse URLs into a route template. For example /products/482 and /products/483 will show up as two different routes, unless you use one of the Flare router integrations. Our integration will hook into the framework's router and group the URLs under their route template: /products/:id.
For React we support TanStack Router and React Router. We also support Vue Router, SvelteKit and Inertia.
All requests your page makes
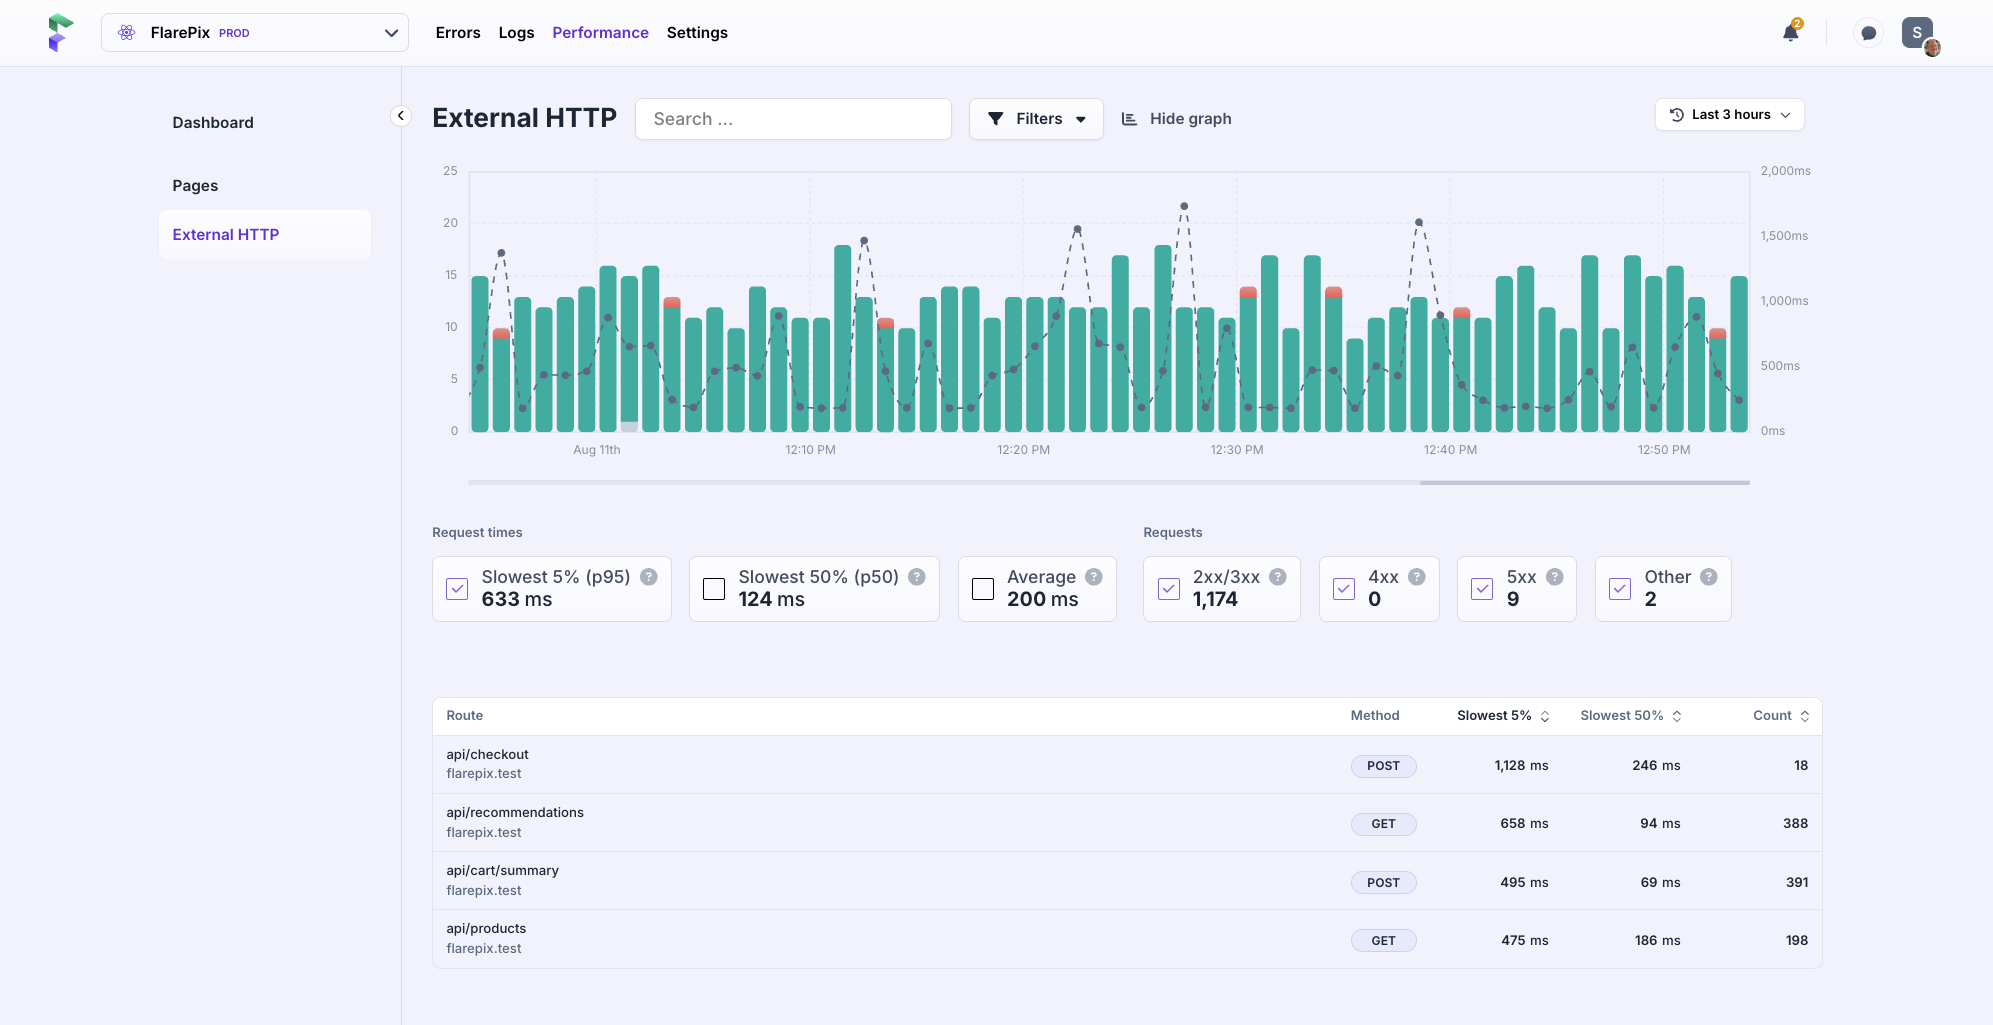
Fetch and XHR calls are grouped by method, host and path and can be found under External HTTP.
In closing
Everything is out today: @flareapp/js for the base client, plus @flareapp/react, @flareapp/vue, @flareapp/svelte, @flareapp/sveltekit or @flareapp/inertia for router integration and component profiling. The JavaScript quick start walks you through it per framework.
You can try our error tracker, logging and performance monitoring right now. Just create your Flare account, we offer a free 10-day trial.
Continue reading
A critical PHP vulnerability: what we did and what you should do
A critical vulnerability in PHP was disclosed today. It lets an attacker run code on your server without logging in, on a PHP install with default settings. That’s about as bad as it gets.

Ruben
Introducing: Dark mode for Flare
We heard you, so here it is: a Dark Mode for Flare!

Dries
Subscribe to Backtrace, our quarterly Flare newsletter
No spam, just news & product updates