Working with error occurrences
Let's look at the screen you'll see when clicking on one of the errors in the project's error list. It's arguably the most important screen of Flare: here's what the error details screen looks like.
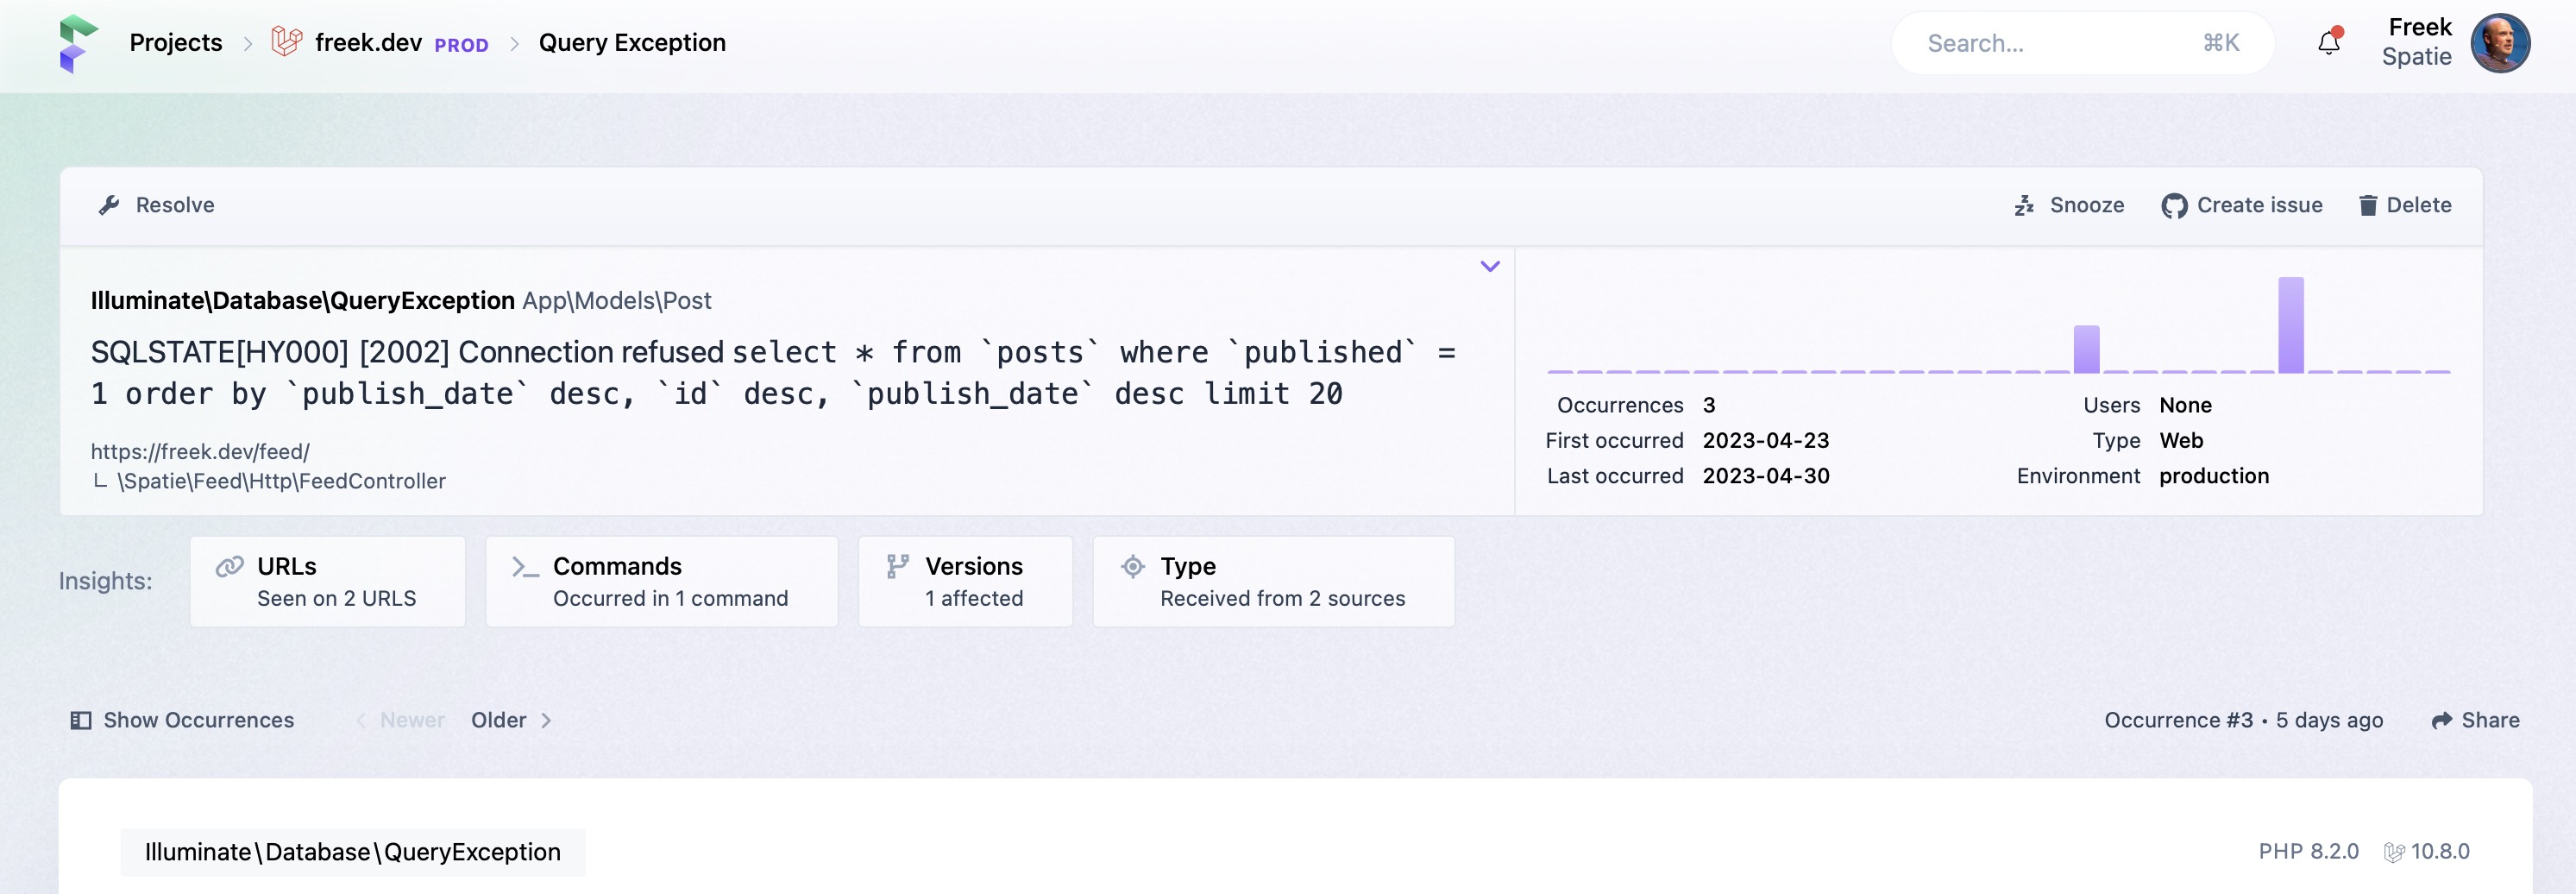
You can see that it's completely revamped. We start by showing the same error card with all details that you saw in the list.
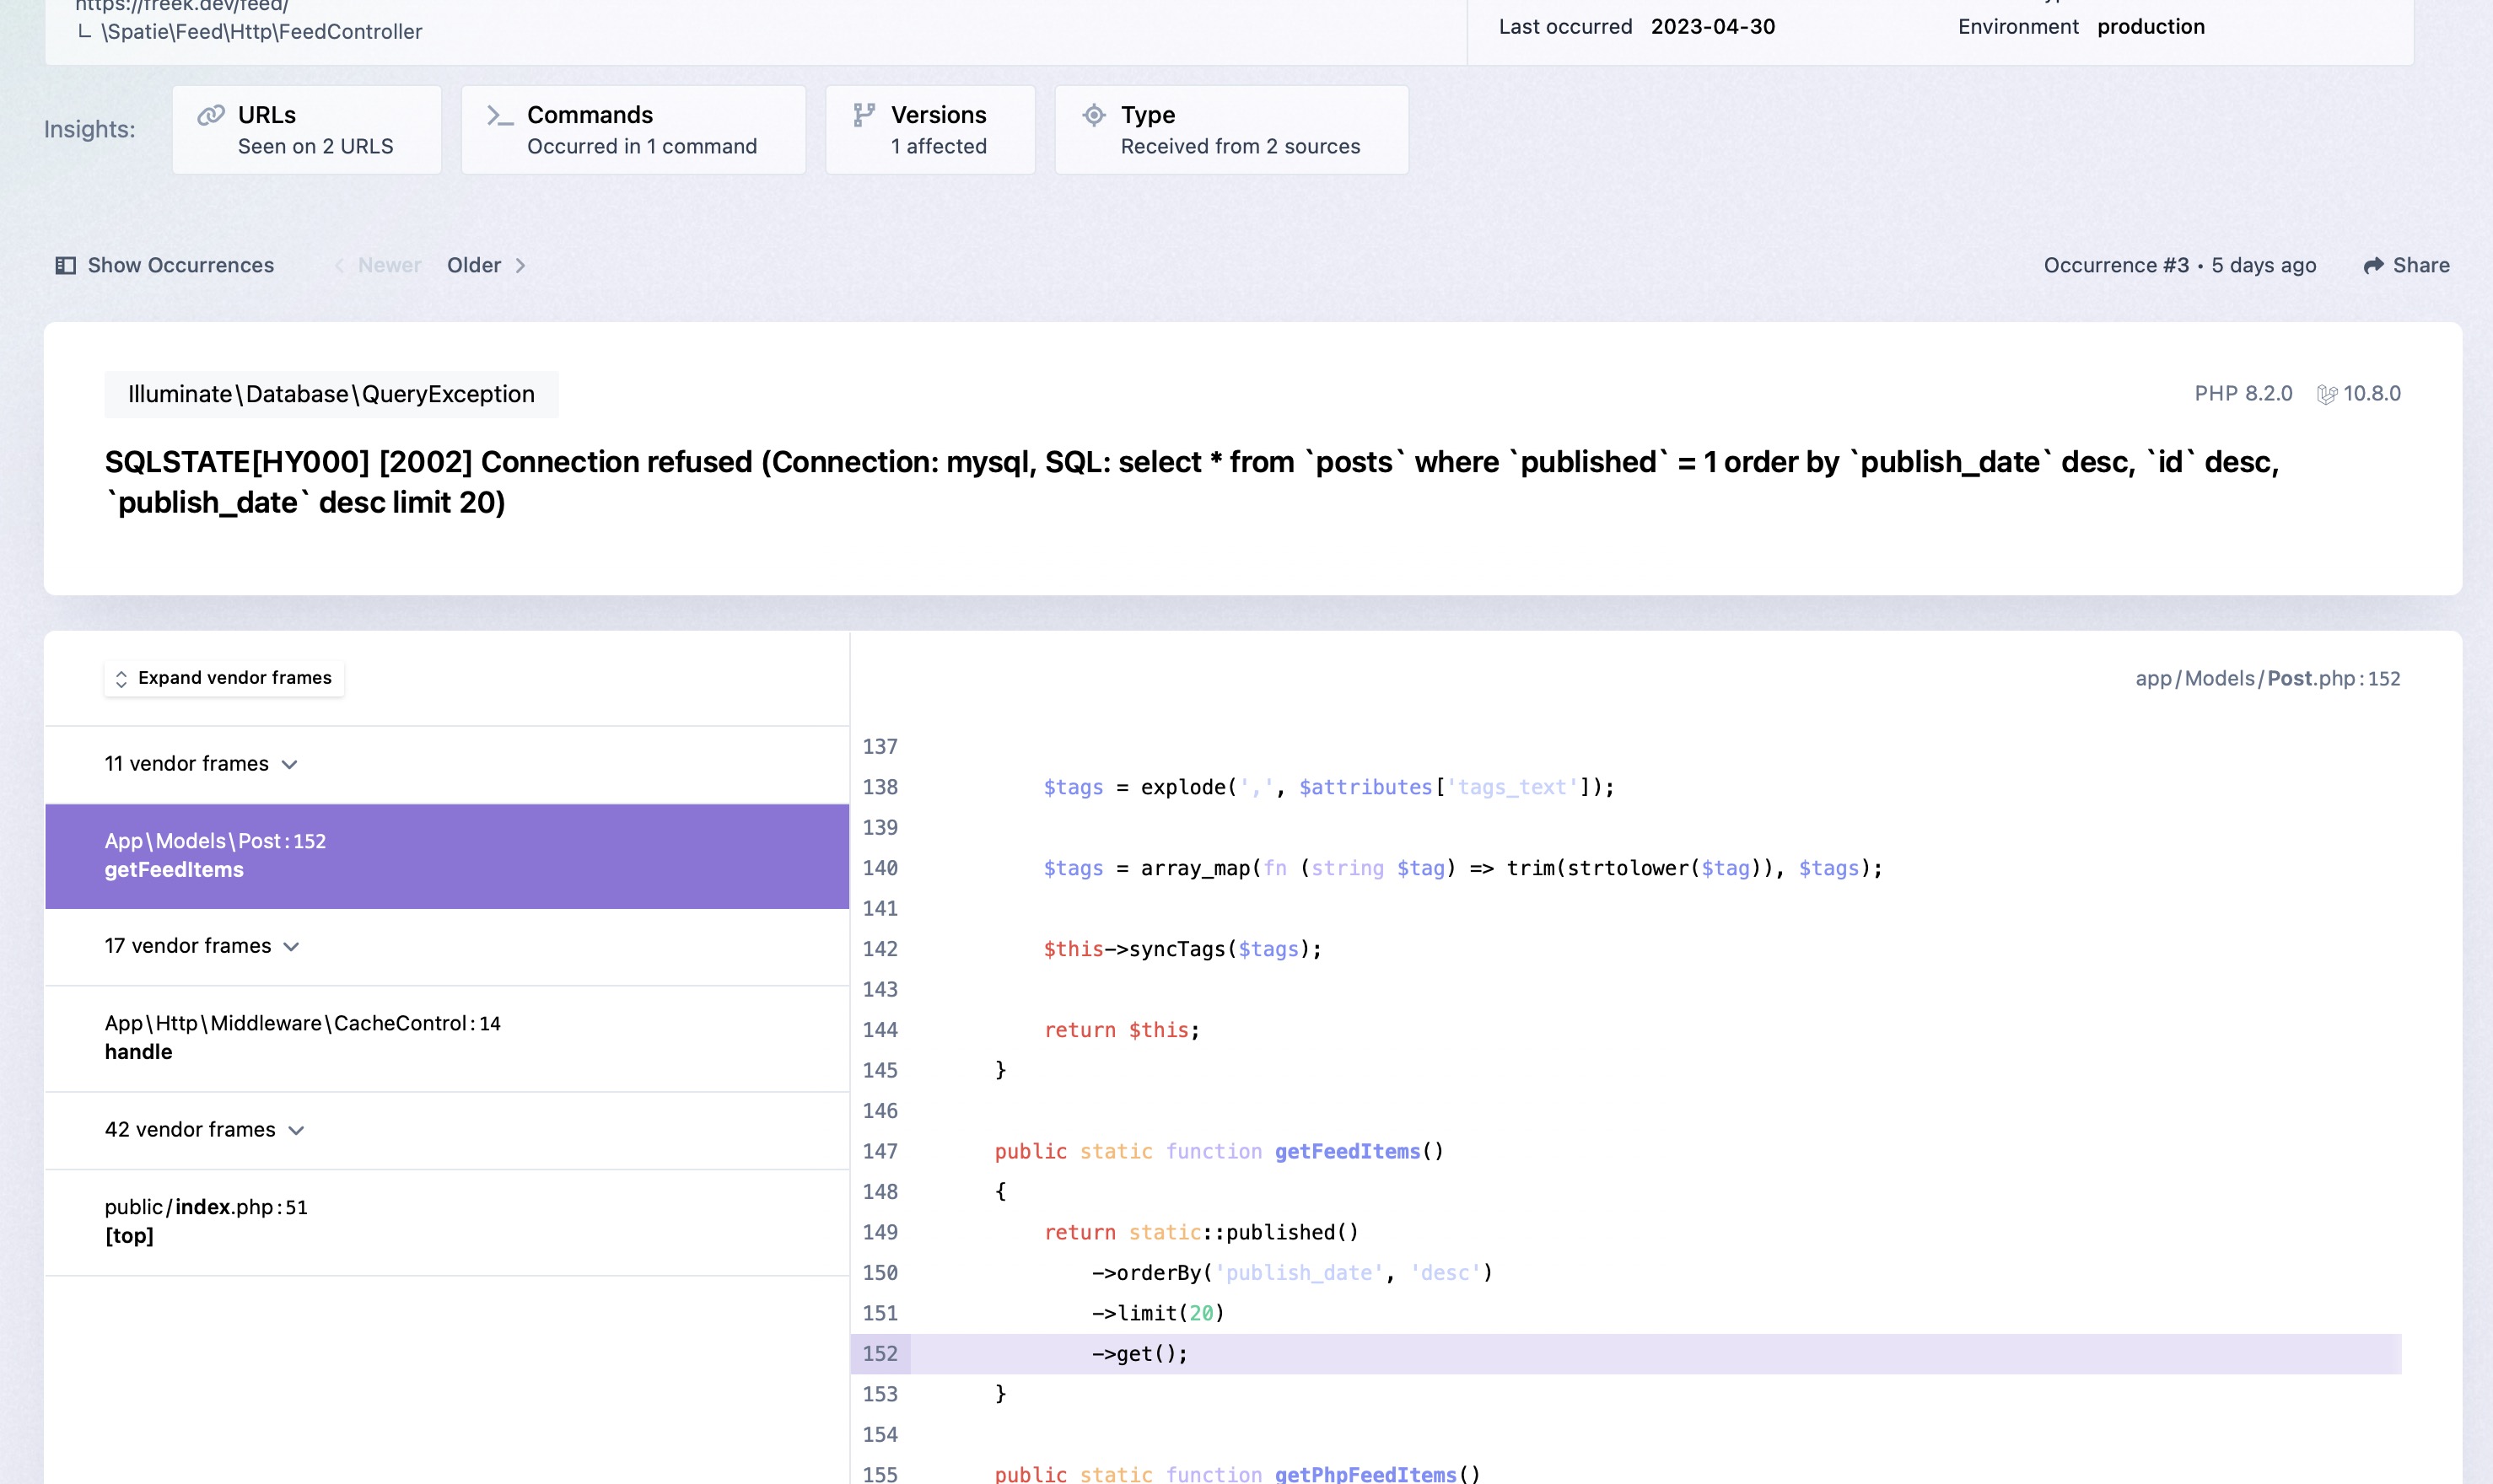
When scrolling down, you'll see the stack trace of the error. It should feel very familiar, as it's rendered by the same component that also renders Ignition, the default Laravel error page.
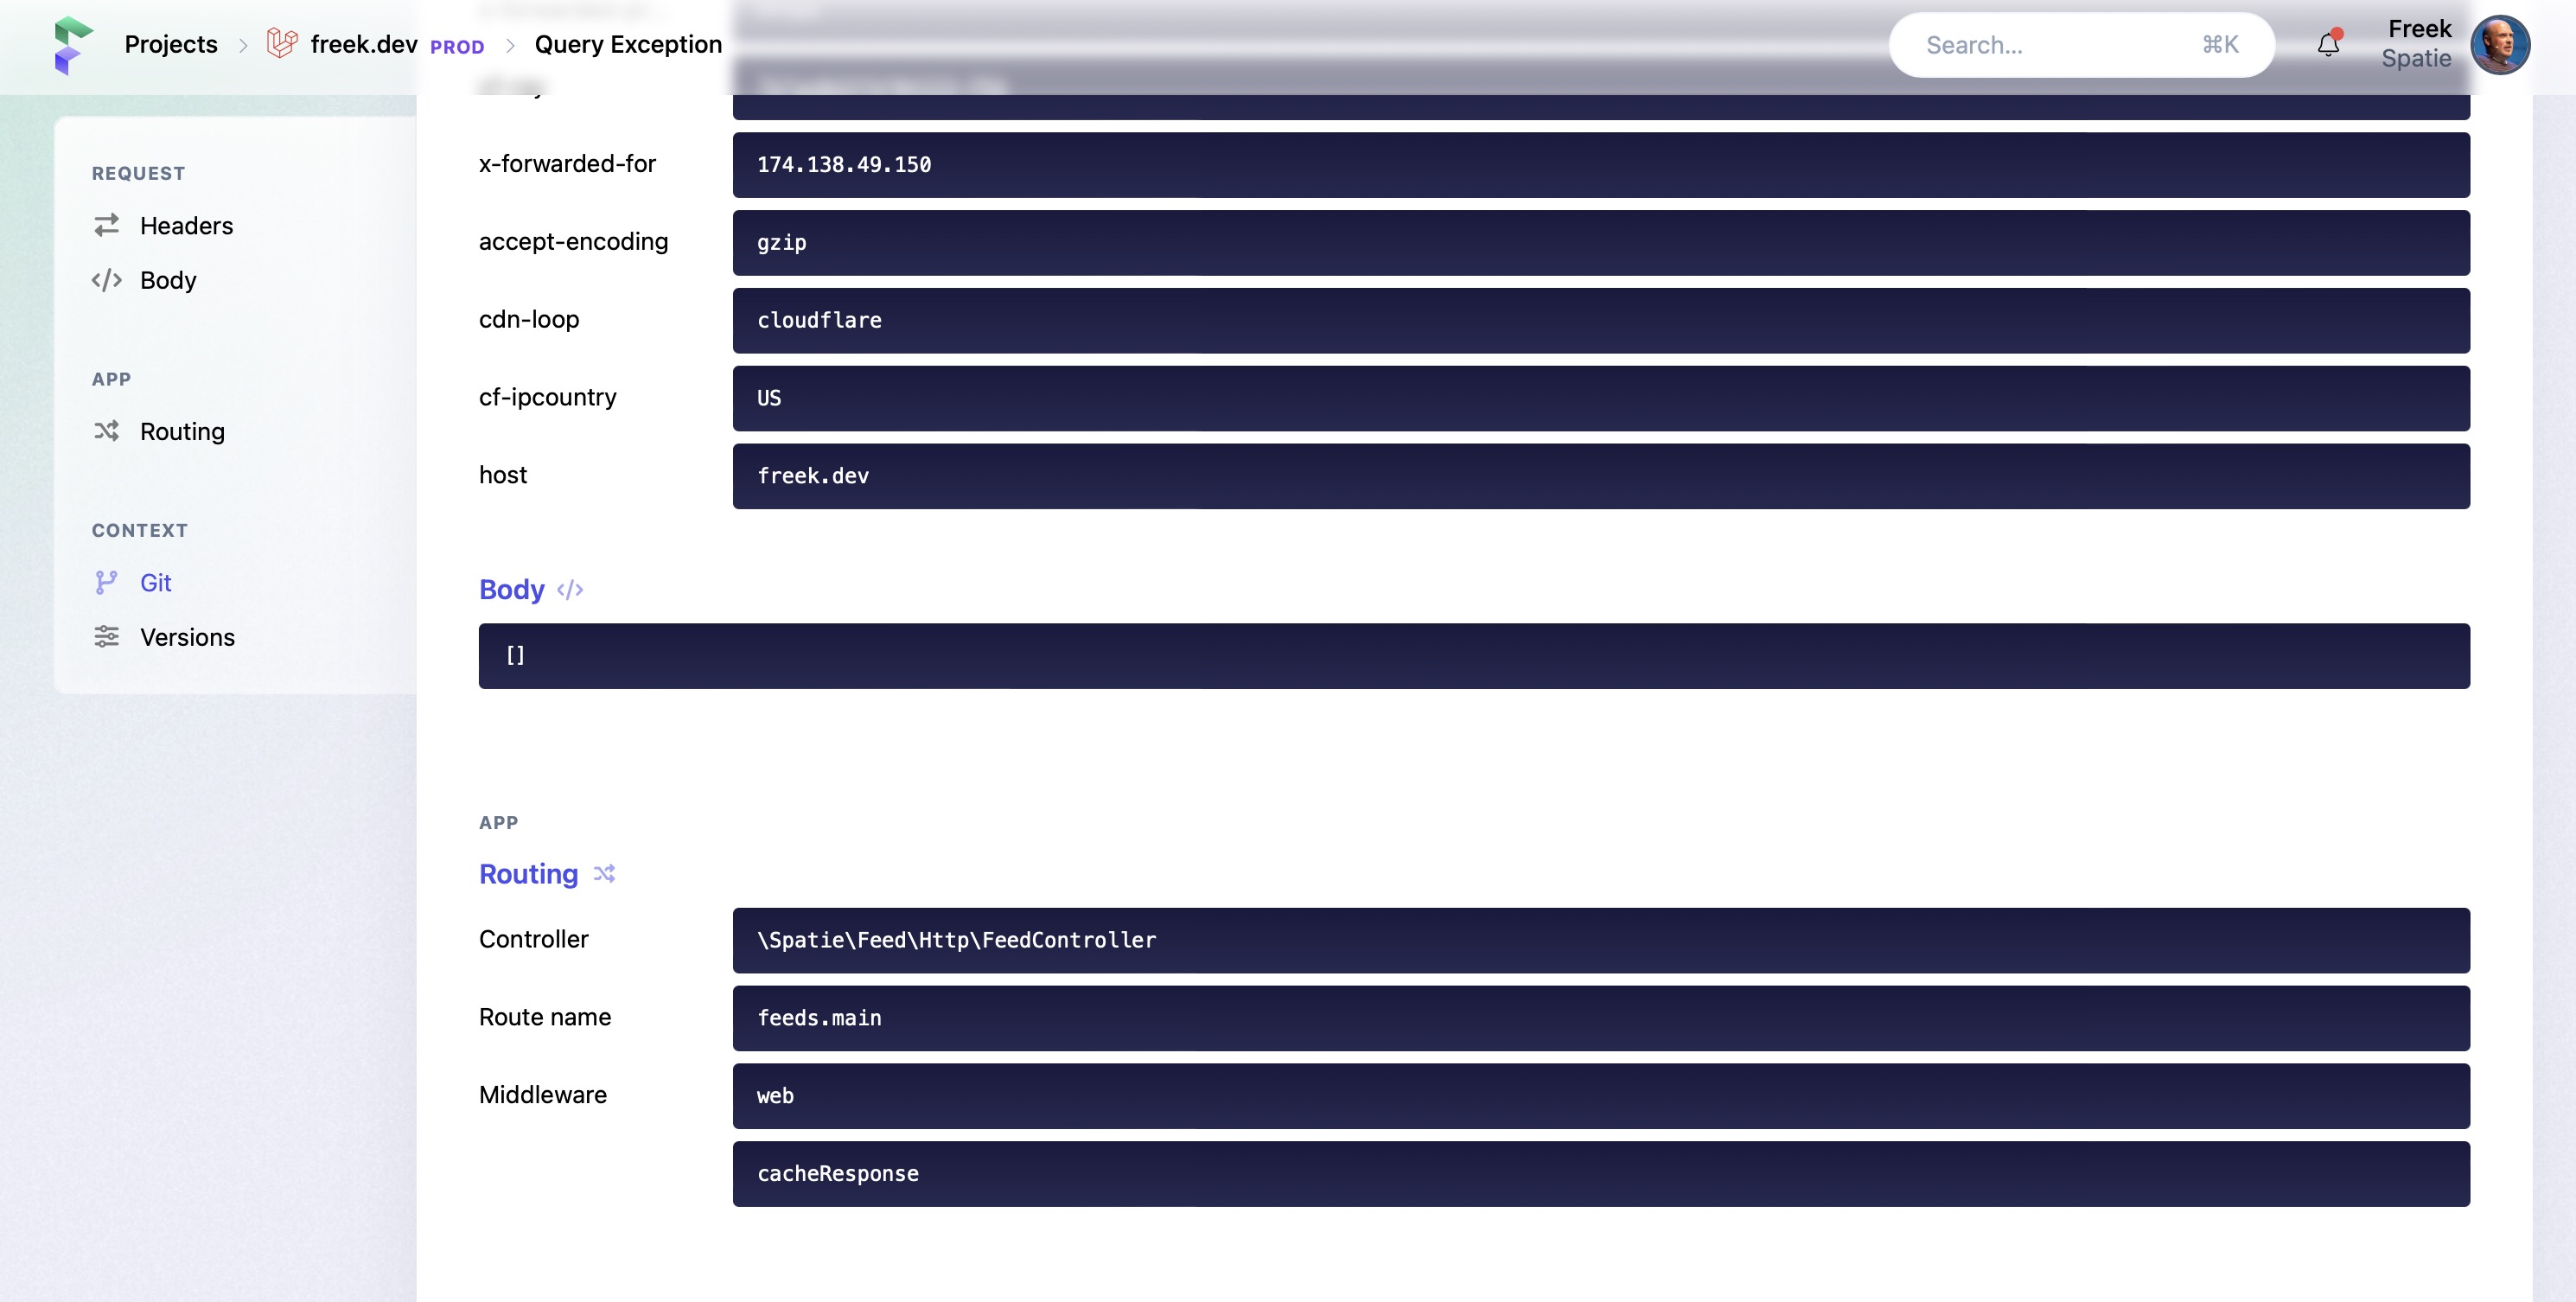
When scrolling down some more, you'll see all the app-specific details, also shown in Ignition—a true treasure trove of information.
Error insights
Scroll back to the top of an error, and you'll see one of the most significant new features: error insights.

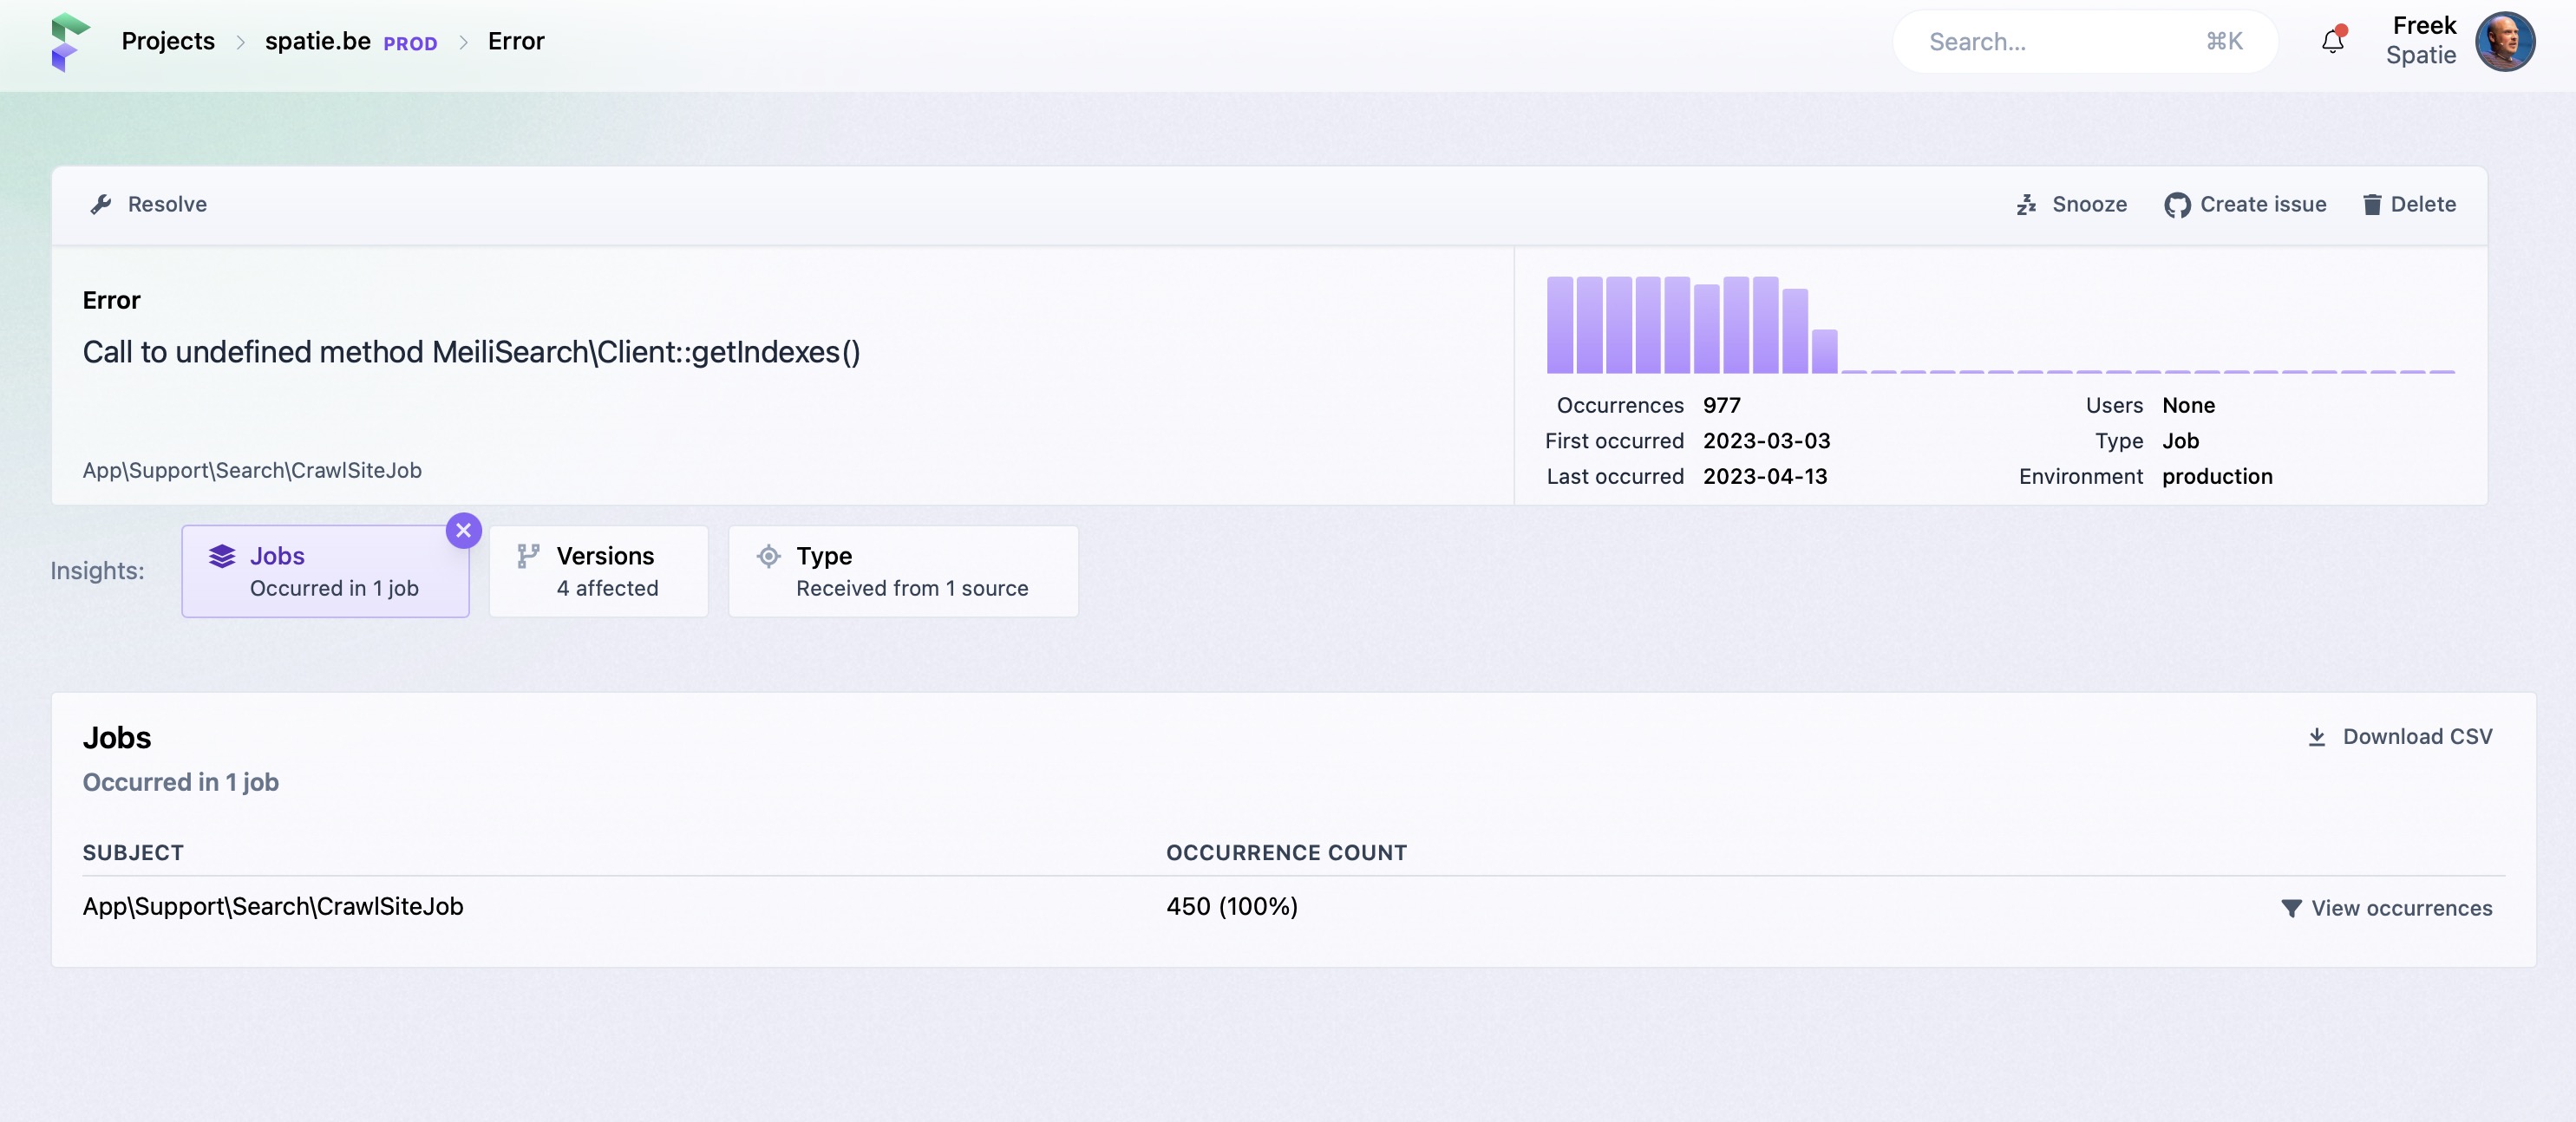
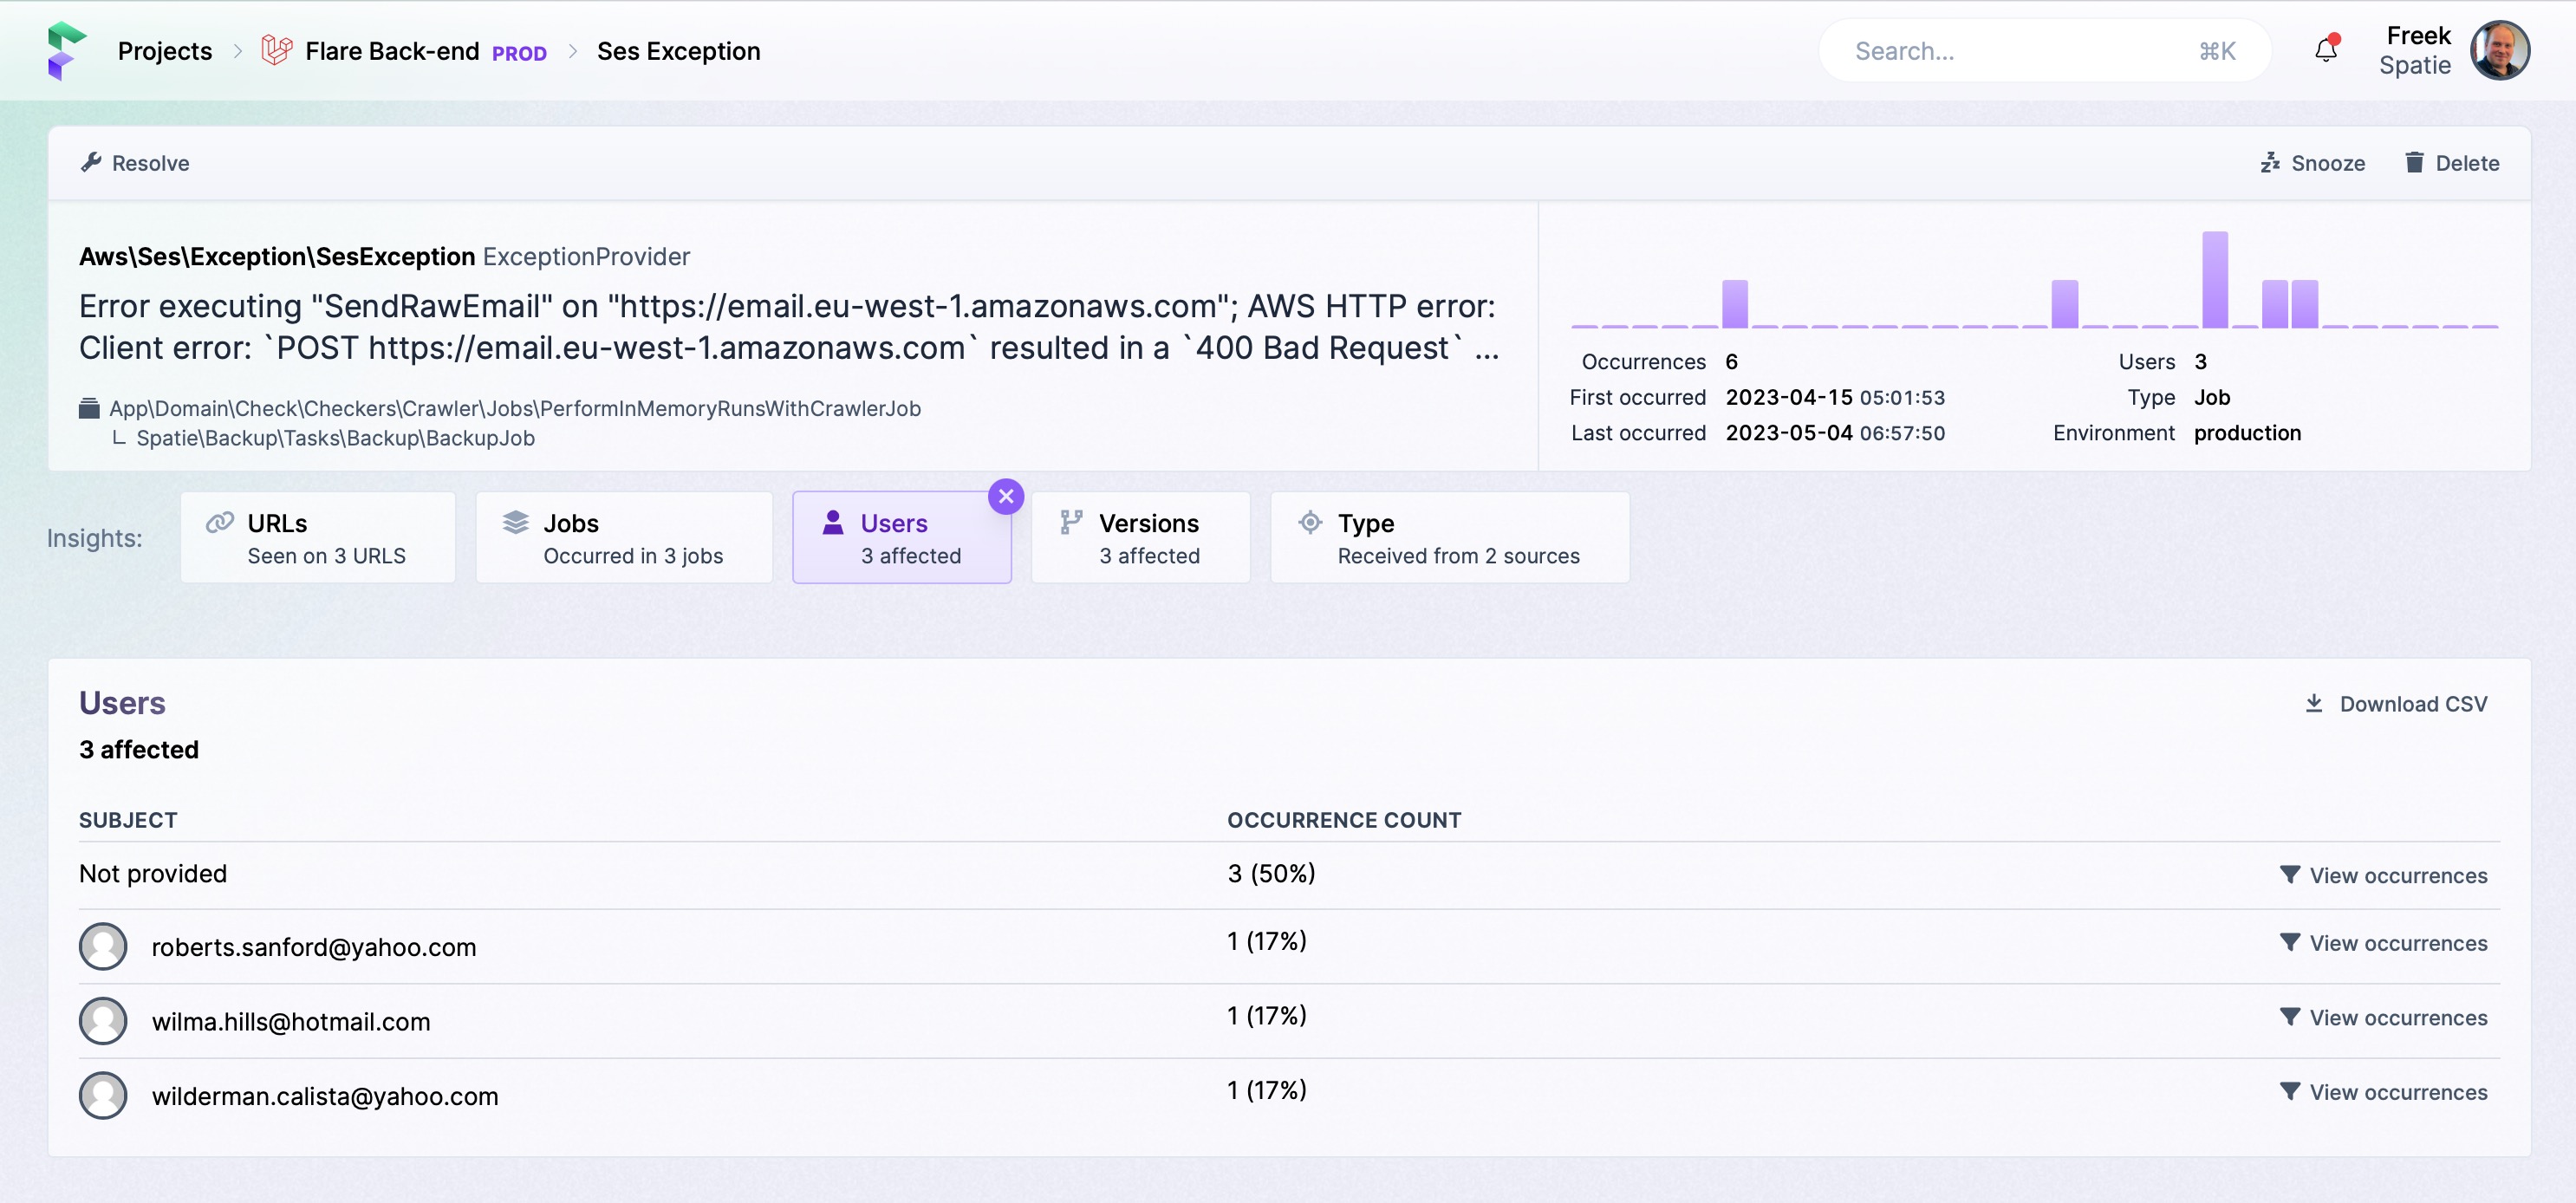
Using these insights, you can quickly see all the places where an error occurred and which of your users encountered it.
The URL insight shows a list of URLs where this particular URL was seen.
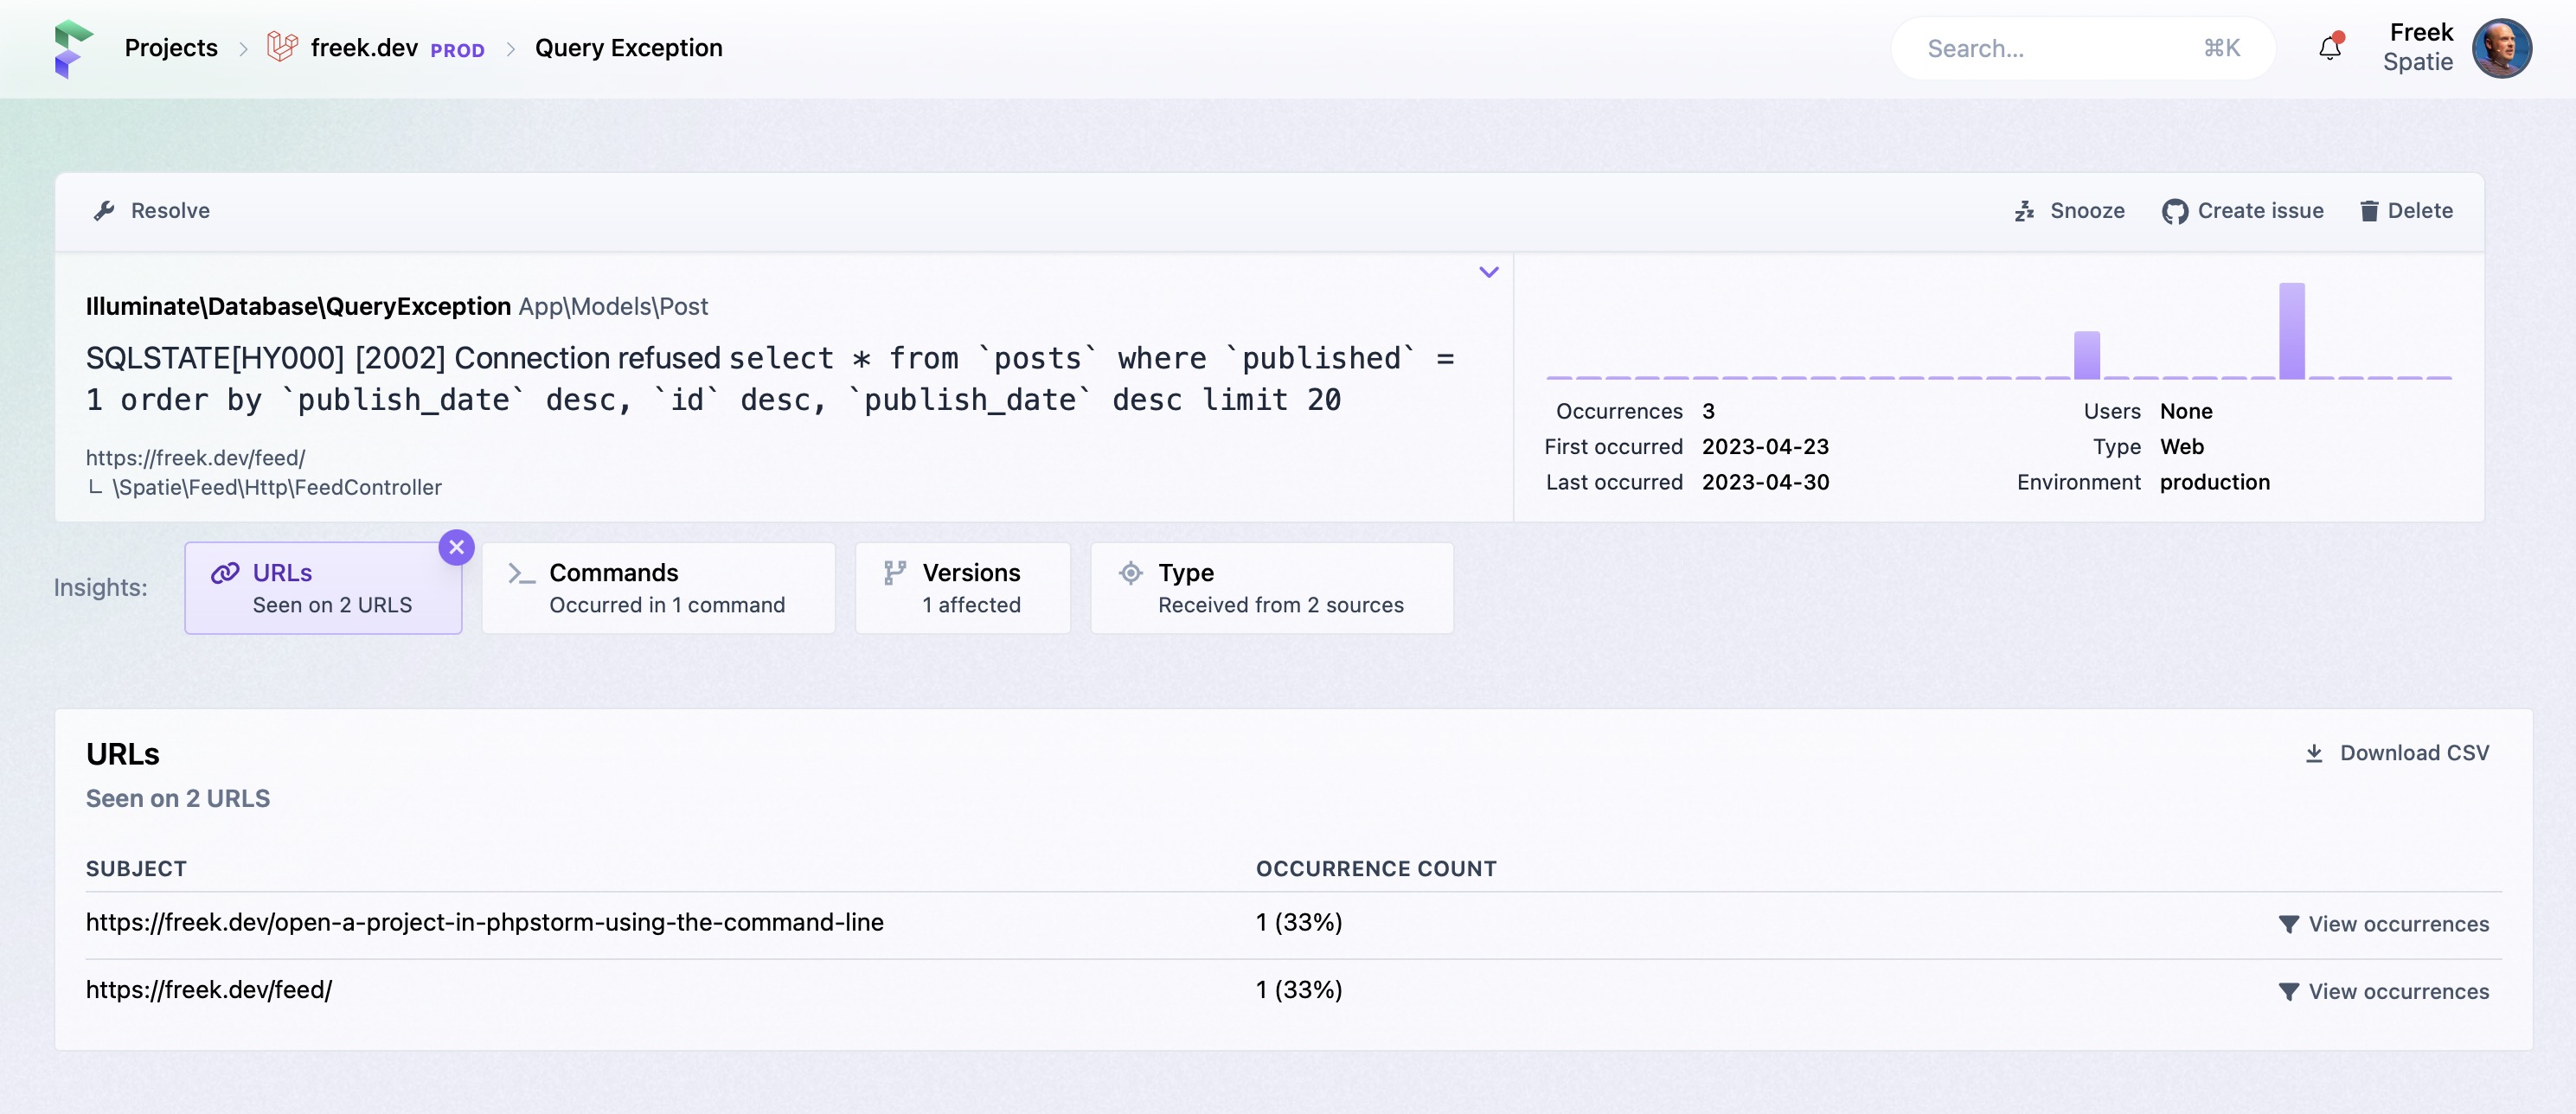
Each insight has a "Download CSV" button in the top right corner that allows you to download a list with results.
Let's take a look at a few other insights. Here are the jobs an error occurred in:
We think the users insight, which shows the list of users that encountered the error, will be very helpful. Here's how that insight looks like with fake, seeded email addresses.
- On this page
- Error insights

