Working with logs
Logs are timestamped records your application writes as it runs. They capture what happened, when, and in what context, giving you a structured view of your application's behavior over time.
To get started sending logs from your application, see the Laravel or PHP setup guides.
You can use them to understand what your app was doing around the time of an error, trace the lifecycle of a request or job, or spot patterns in production that don't immediately surface as exceptions.
Flare's logging feature is built for PHP and Laravel applications. Like the tracing in Performance monitoring, it is built on top of OpenTelemetry. Severity levels, trace context, and attributes all follow the OpenTelemetry log data model. Once your application is sending logs, Flare makes them searchable and filterable in real-time.
Anatomy of a log message
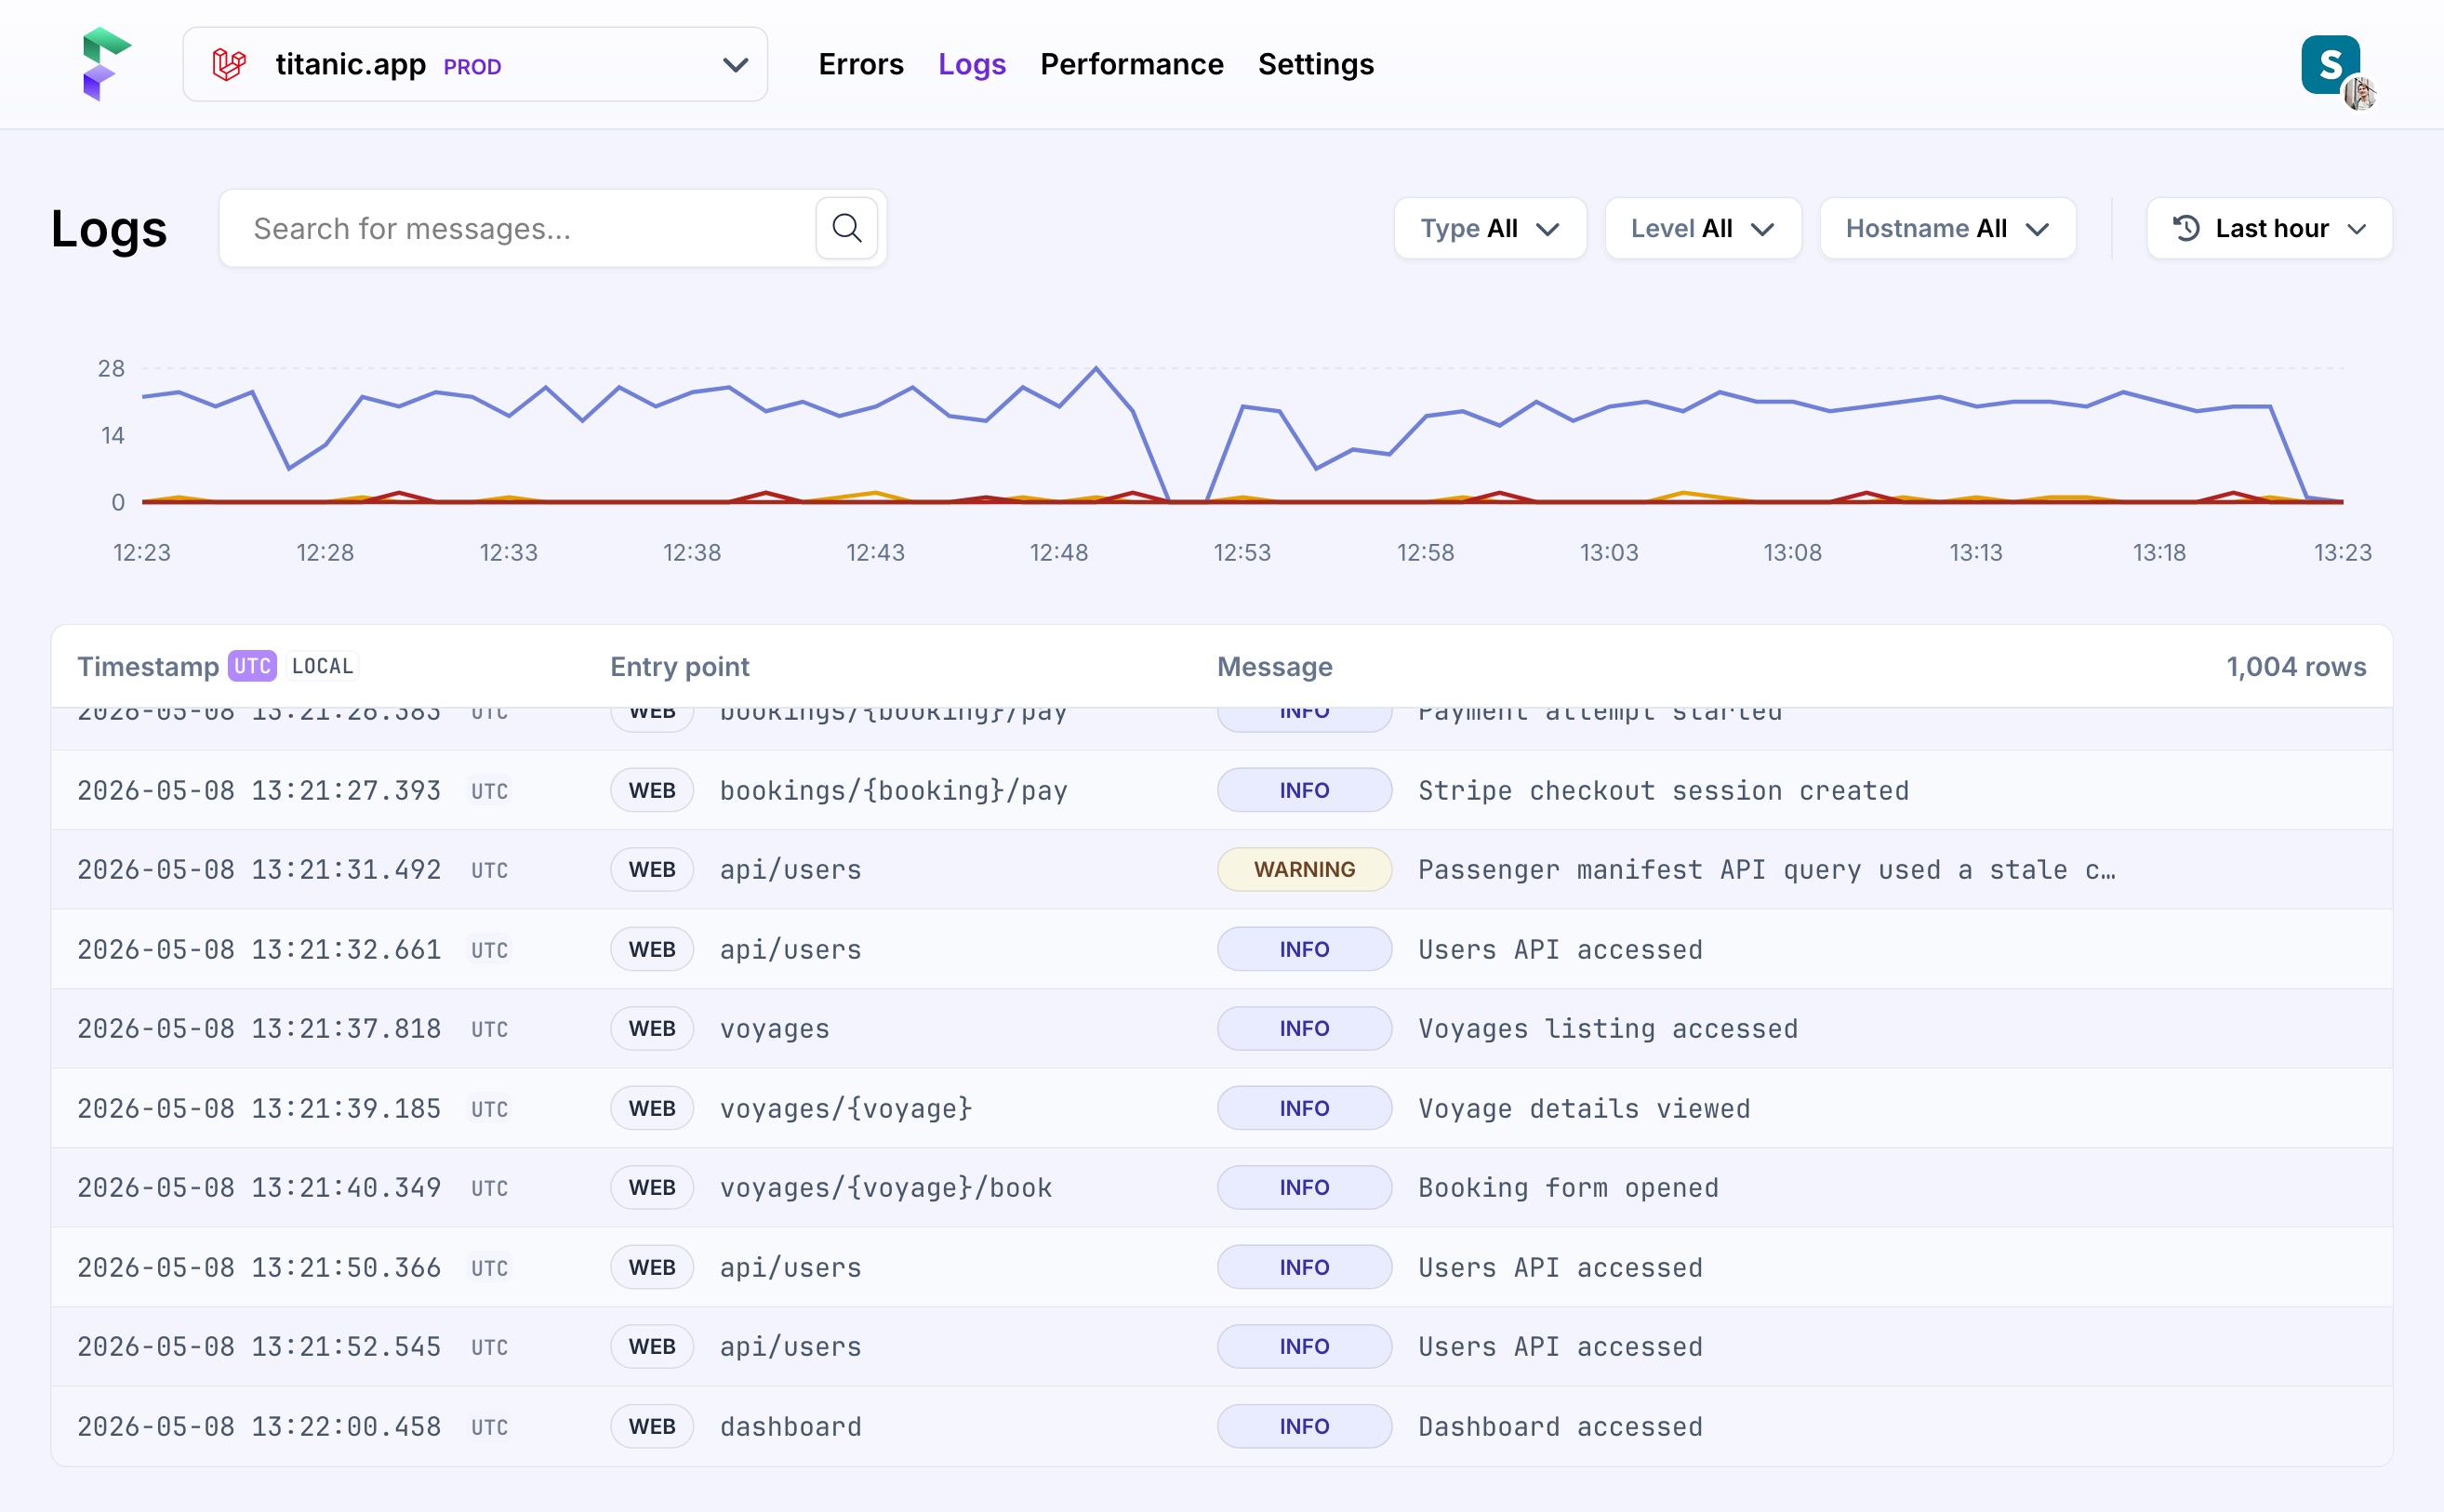
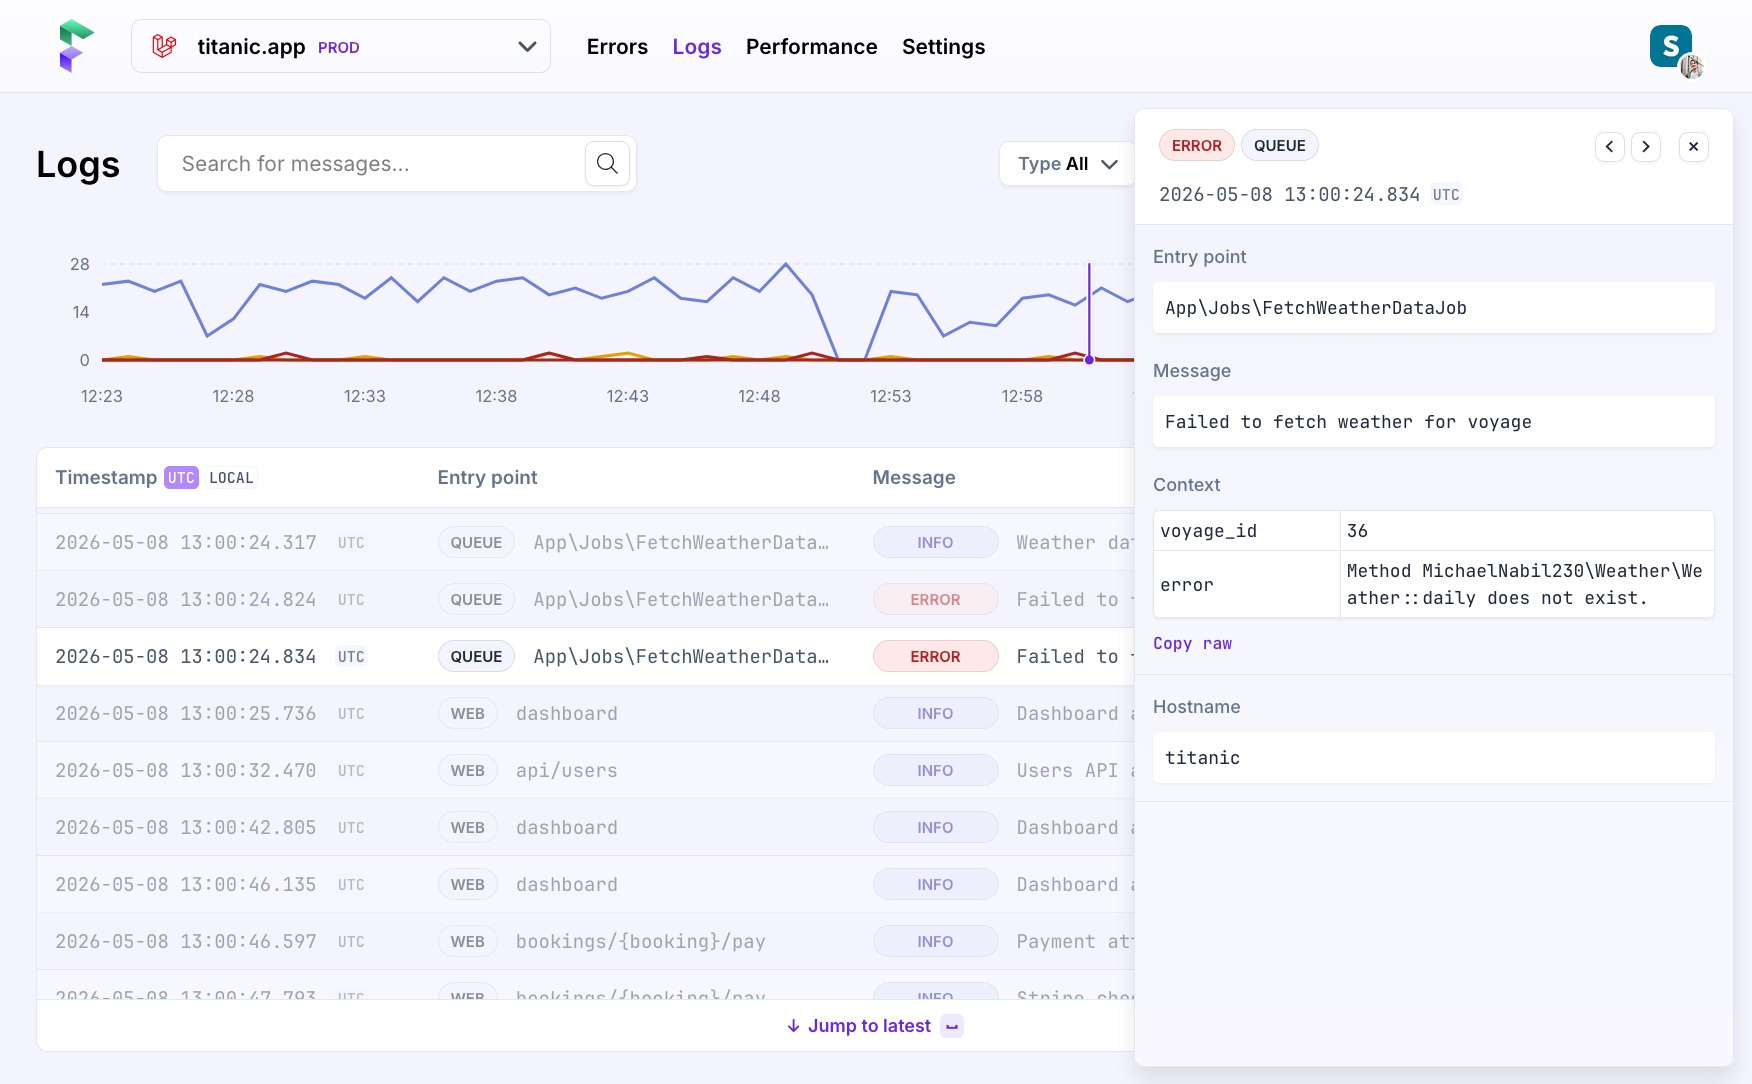
We collect and display the hostname, timestamp, entry point, severity levels, message context, and other attributes you include in the payload. Our log list shows you the most important information. Clicking a log opens an additional view with more details, including context.
What we display
-
Severity levels are mapped on common Laravel & OpenTelemetry values. By default, we show you all, but you can easily show or hide the ones you don't need.
-
Search lets you filter logs by message content. The search matches against the log body, so you can quickly find logs containing a specific string.
-
Hostname allows you to filter by what server or machine has sent you the log. This becomes very helpful when you have a multi-server setup with multiple workers.
-
Entry points are the requests, jobs or commands responsible for sending the log.
-
Messages can include a custom log message you added, and optionally also include additional arbitrary context displayed as a key/value pair. You can fully copy the structured JSON.
If you include a trace ID and span ID in your payload, Flare stores and displays them in the log detail view, allowing you to correlate logs with traces.
Managing time
By default, logs are shown for the last hour with the most recent entries at the bottom. As you scroll, a scrubber indicates where you are in the timeline.
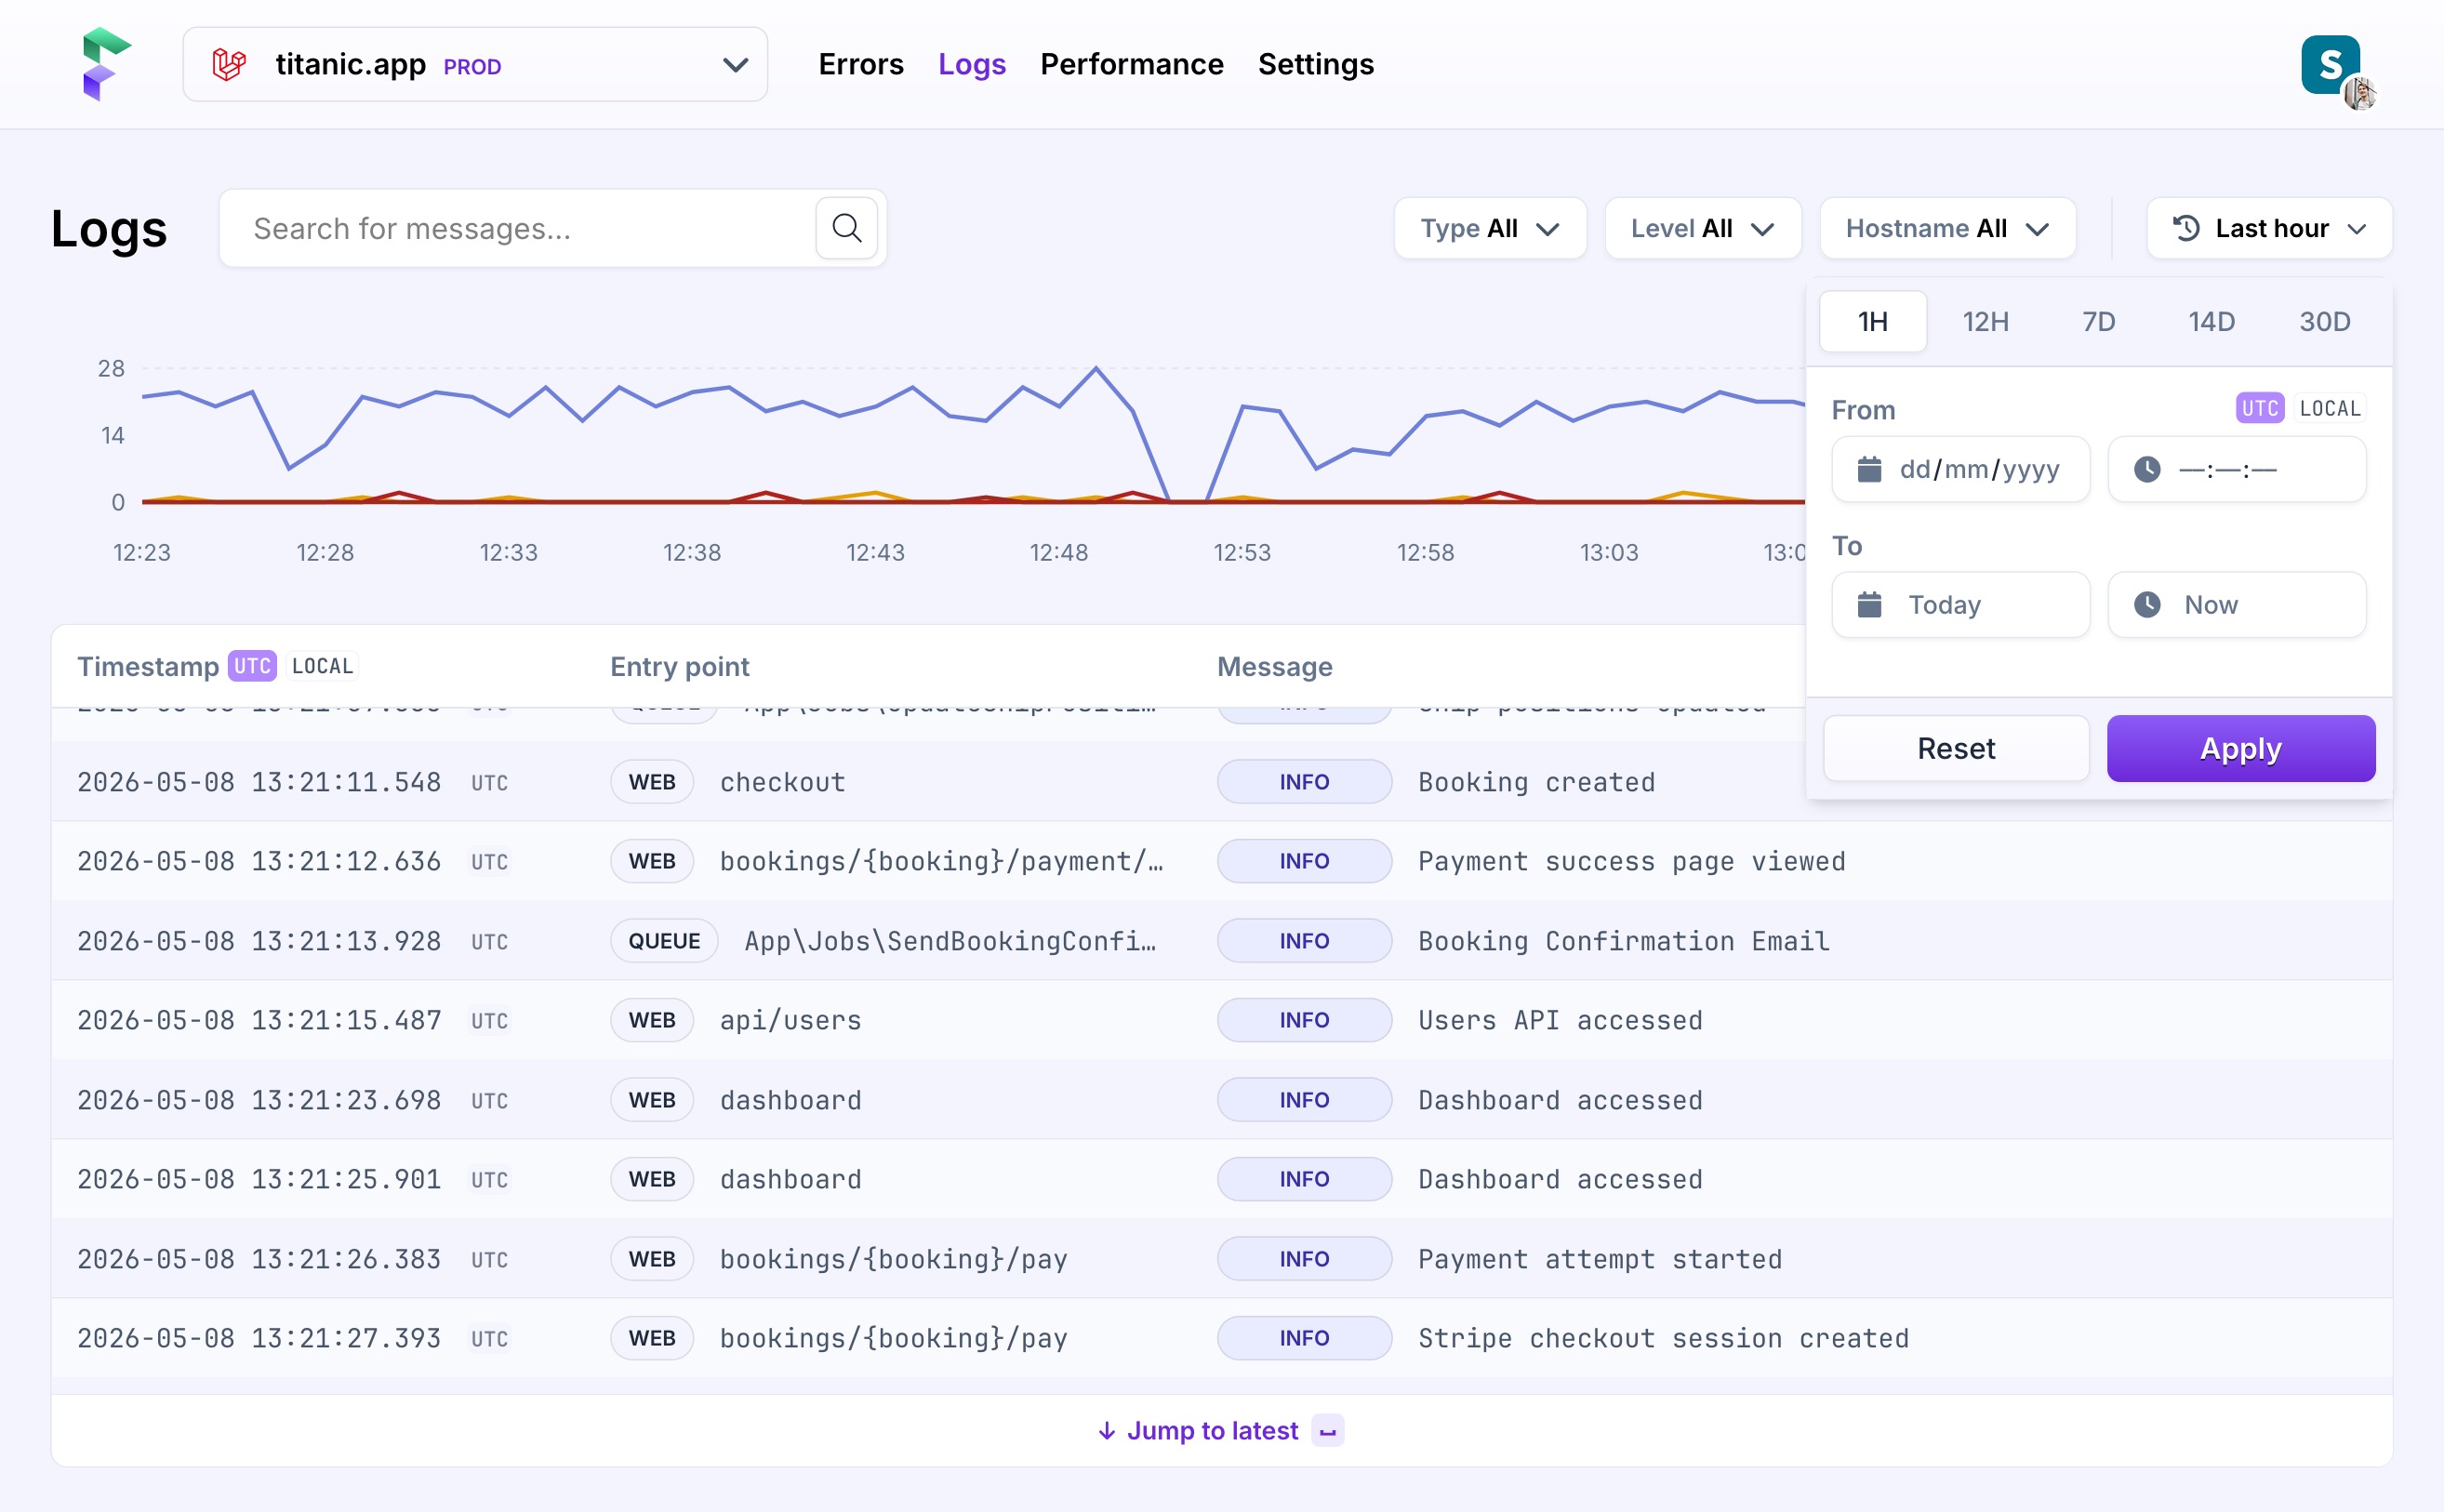
To zoom in on a specific moment, click and drag directly on the timeline to define a custom range. You can also switch between preset timeframes of 1H, 12H, 7D, 14D, and 30D, or enter a precise start and end time manually through the menu.
Timestamps are shown in UTC by default, matching the time reported in the log payload. You can switch to your local (browser) timezone by clicking the 'Local' badge. Hovering over any timestamp shows both.
On this page