


 Flare
 PHP
 JavaScript
 Protocol
Dashboard
Routes, jobs, and commands represent the entry points of your project. Queries, along with operations including external HTTP and views, are triggered by these entry points.
On the dashboard, all this data is brought together.
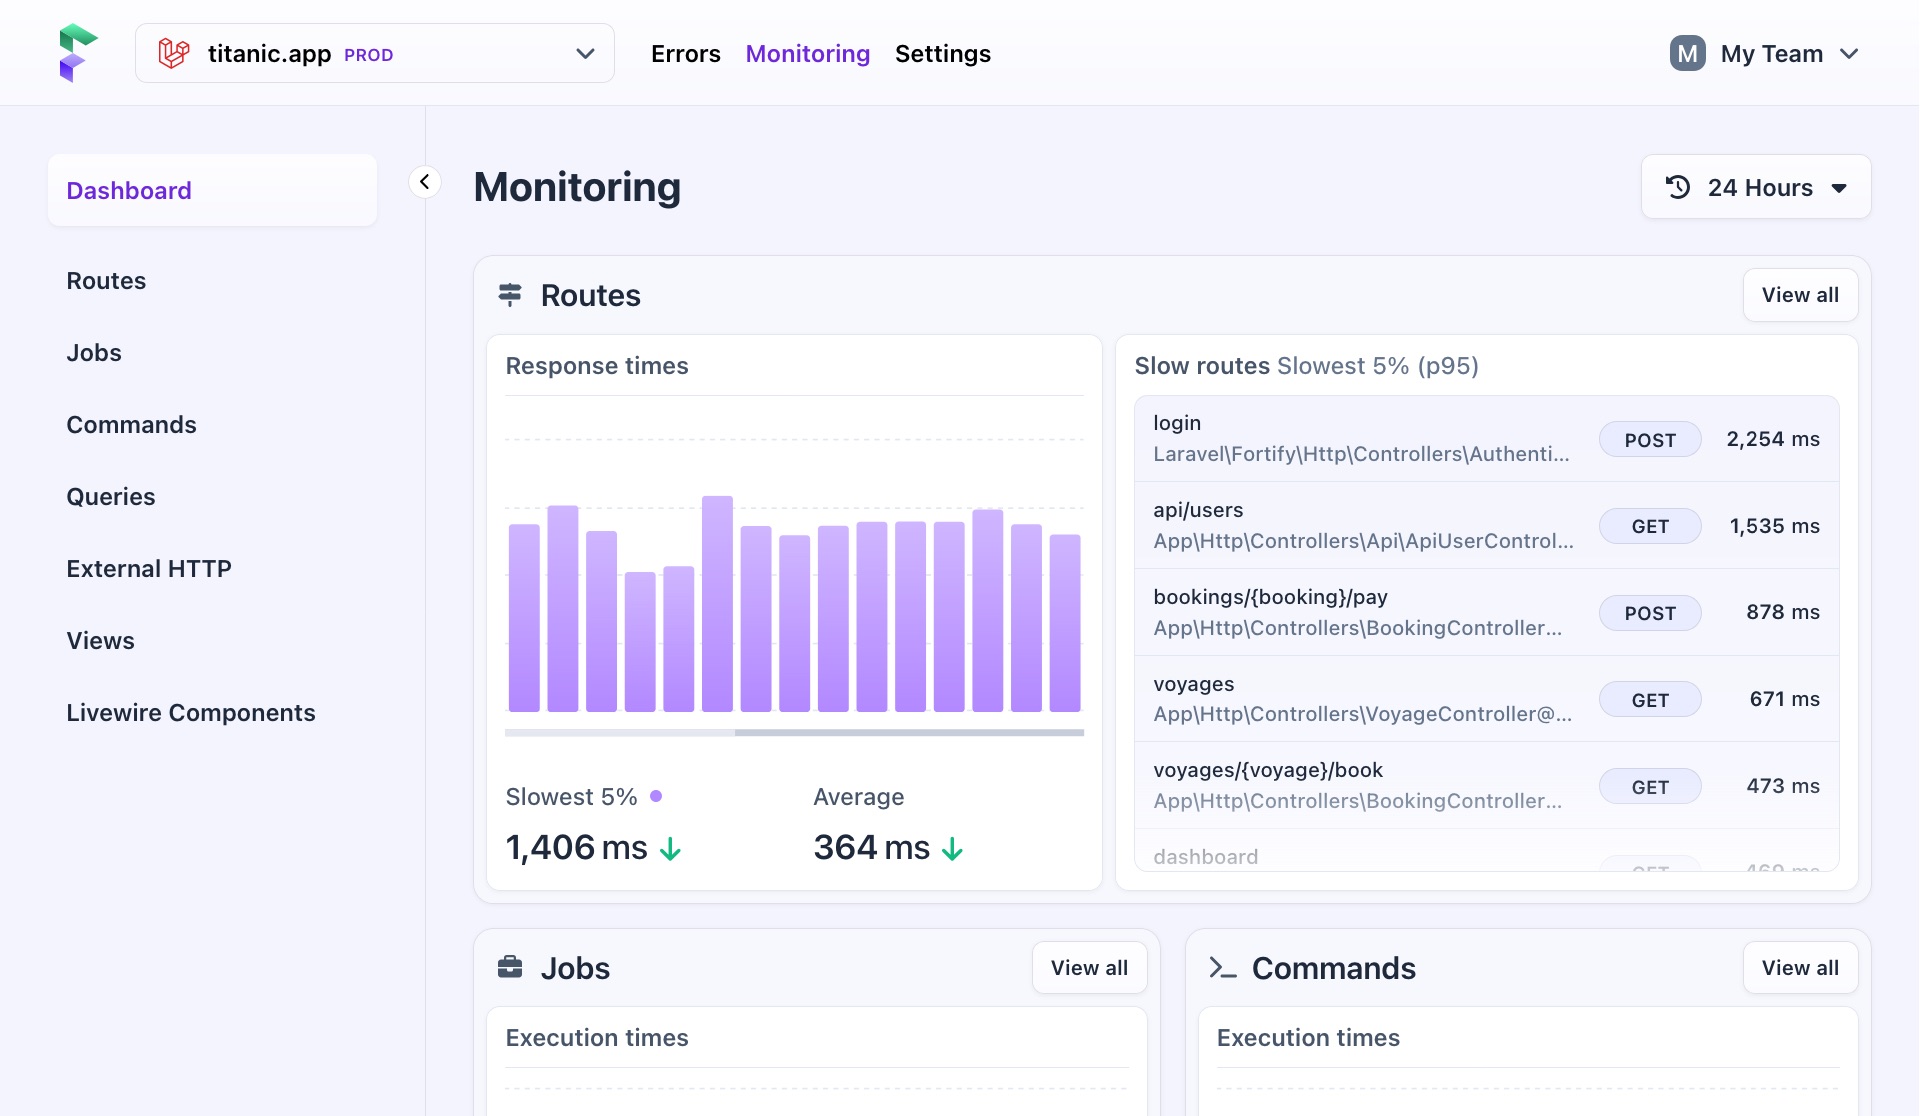
Data on the dashboard
The dashboard has cards for each entry point and for queries.
Routes
Shows you all tracked requests in your project, displaying the slowest 5% (p95) and average response times on a graph, along with a list of the slowest routes, their controllers, and request methods.
Jobs & Commands
Shows you all executed queued jobs and commands, highlighting the slowest 5% (p95) and average execution times on a graph.
Queries
Shows you all database queries, including those executed by routes, jobs, and commands. It shows the slowest 5% and average execution times on a graph, along with a list of the slowest running queries.
Changing the time period
Performance data is real-time, so you need control over it. By default, Flare shows data for the last 6 hours, enough to spot outliers that may have started recently.
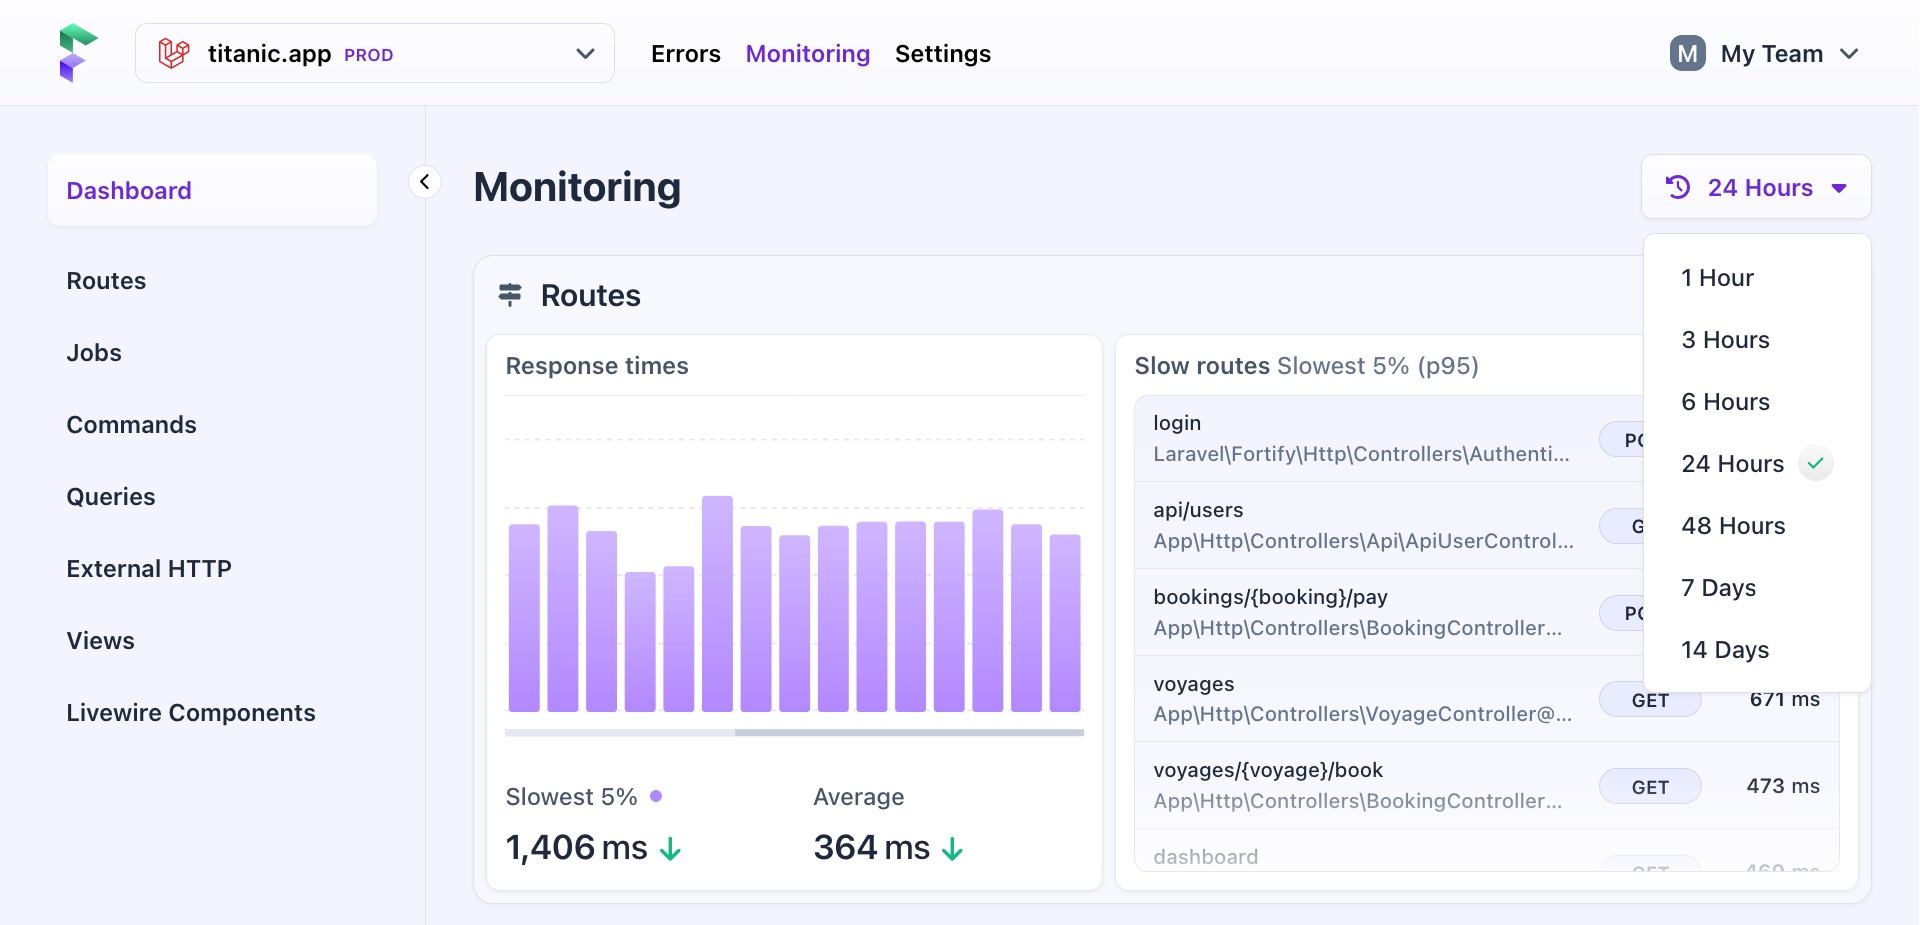
You can use the menu in the upper right corner to increase or decrease the amount of data you see, from one hour to 14 days, or pick your own start and end time. This can help you identify a very recent problem or look at performance changes over a longer period of time.
| Period | Smallest bar |
|---|---|
| 1 hour | 1 minute |
| 3 hours | 1 minute |
| 6 hours (default) | 1 minute |
| 24 hours | 1 minute |
| 48 hours | 1 hour |
| 7 days | 1 hour |
| 14 days | 1 hour |
A custom range uses the same steps: minutes up to 24 hours, hours up to 14 days, and days for longer ranges (up to 30 days). When a chart has less room, Flare combines several of these steps into one bar, so bars on smaller charts can cover a longer time.
The selected time frame is applied throughout, adjusting the numbers and scale in all graphs and tables.
On this page