


 Flare
Flare
 PHP
PHP
 JavaScript
 Protocol
Web vitals
Core Web Vitals are five numbers the browser measures about a page load. Flare collects them from your JavaScript projects and shows them in three places: on the Pages table, where you compare pages against each other, on the Performance dashboard, where you get one number for the whole site, and in the trace viewer, where you look at a single visit.
Only browser projects produce these numbers. See web vitals in the JavaScript SDK for how they get collected.
The five vitals
| Vital | Name | What it measures |
|---|---|---|
| TTFB | Time to first byte | How long it took before the server started answering |
| FCP | First contentful paint | When the first text or image showed up |
| LCP | Largest contentful paint | When the biggest element on screen finished painting |
| INP | Interaction to next paint | The slowest reaction to a click, tap, or key press during the visit |
| CLS | Cumulative layout shift | How much the page moved around while it loaded |
The first four are measured in milliseconds. CLS is a decimal without a unit.
On the Pages table
The Pages table gains four columns: a score, and then LCP, INP, and CLS.
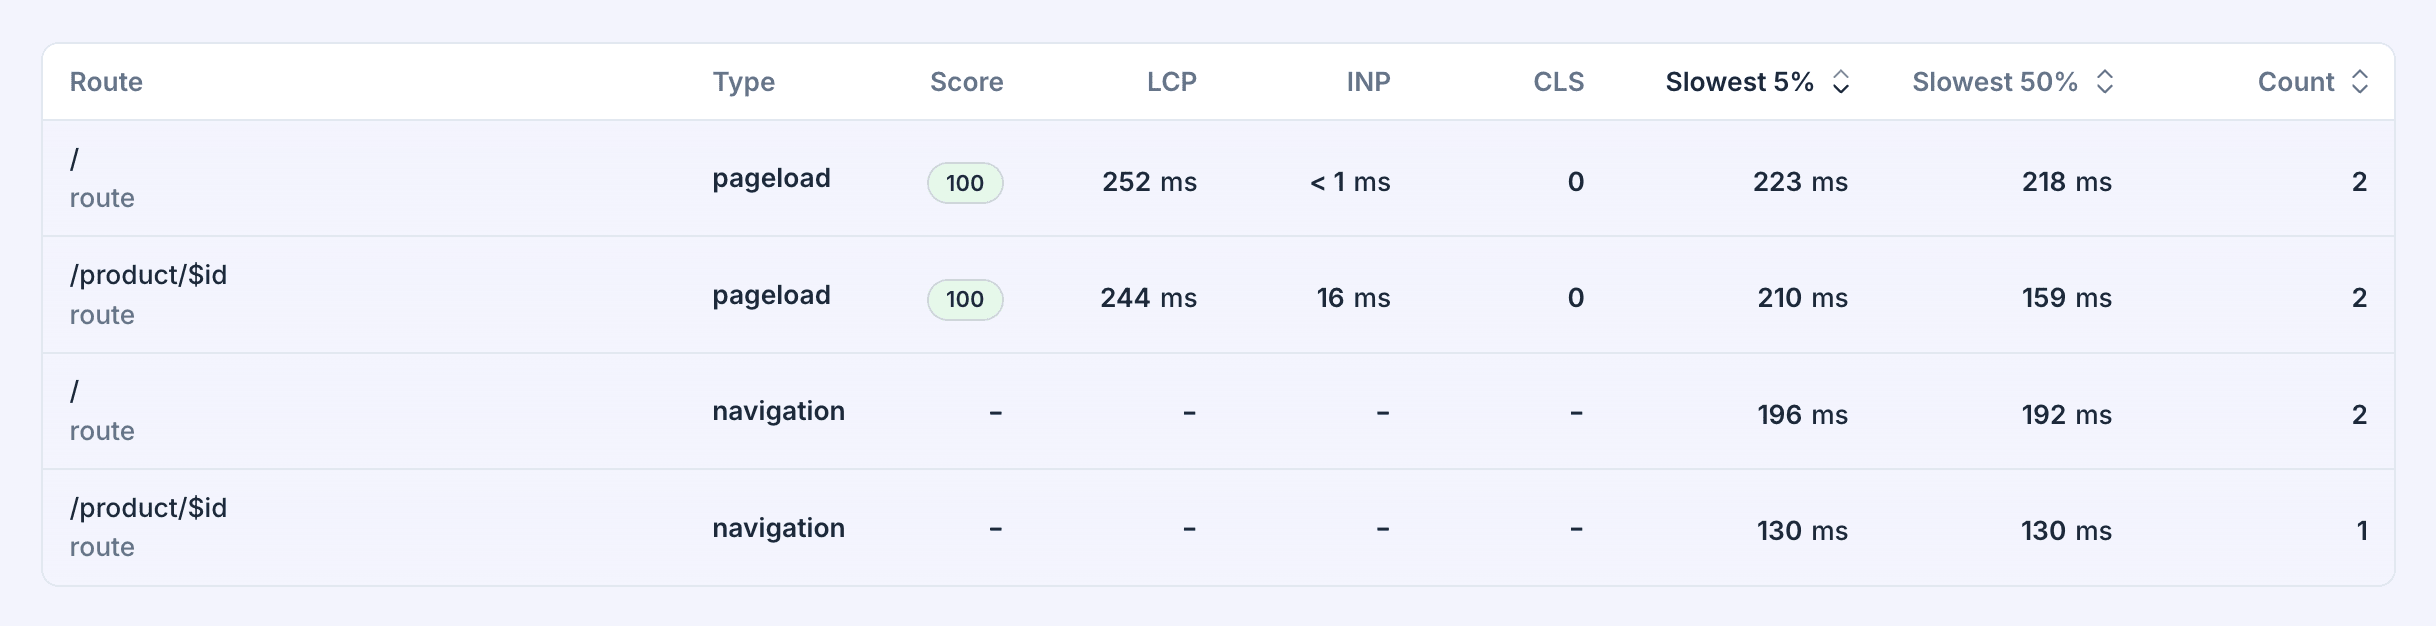
Every number in these columns is a p75 over the period you selected, not an average. So an LCP of 2.1 seconds means that 75 out of every 100 visits to that page painted their biggest element within 2.1 seconds, and the slowest 25 took longer. This is the number Google itself uses to judge a page, because an average hides your slowest visitors behind your fastest ones.
TTFB and FCP are missing from the table on purpose. They are still collected, and they still count towards the score, but LCP, INP, and CLS are the three Google calls Core Web Vitals, and a table with eight number columns is hard to read. You still see all five on a trace detail.
A column shows - when Flare has no measurement for that page. That usually means your visitors use a browser that can't measure it. CLS only works in Chromium browsers, so a page visited mostly from Safari shows - for CLS.
Thresholds
Each vital has two boundaries, taken from Google's published Core Web Vitals thresholds. Below the first one is good, above the second one is poor, and in between needs improvement. Flare colours every value green, yellow, or red on those boundaries.
| Vital | Good | Needs improvement | Poor |
|---|---|---|---|
| TTFB | up to 800 ms | 800 to 1800 ms | over 1800 ms |
| FCP | up to 1800 ms | 1800 to 3000 ms | over 3000 ms |
| LCP | up to 2500 ms | 2500 to 4000 ms | over 4000 ms |
| INP | up to 200 ms | 200 to 500 ms | over 500 ms |
| CLS | up to 0.1 | 0.1 to 0.25 | over 0.25 |
The score
The score puts all five vitals into one number between 0 and 100, so you can quickly spot which page needs your attention first without reading five columns.
Each vital is scored on its own first, using the boundaries in the table above. A value sitting exactly on the good boundary scores 90. A value sitting exactly on the poor boundary scores 50. The five scores are then weighted and added up:
| Vital | Weight |
|---|---|
| LCP | 30% |
| INP | 30% |
| CLS | 15% |
| FCP | 15% |
| TTFB | 10% |
LCP and INP carry the most weight because they describe what your visitor actually waits for. TTFB carries the least, because a fast server does not save a page that paints slowly.
The score is coloured the same way a single vital is: 90 and above is good, 50 to 89 needs improvement, below 50 is poor.
When the score is missing
When a vital was never measured, its weight is dropped and the remaining vitals are rescaled to fill the gap. A page with no CLS is scored on the other four.
Flare only shows a score when at least half of the total weight is present. Below that you get a - instead.
This rule exists because TTFB and FCP are the two that arrive earliest and most reliably, and they are usually green. Together they are a quarter of the weight. Scoring a page on those two alone would show a comfortable 95 while saying nothing about the parts your visitors feel most.
On the dashboard
The Performance dashboard opens with a "Browser pages" block. The two tiles at the top of that block show the web vitals of your whole site, over the period you picked in the top right corner.
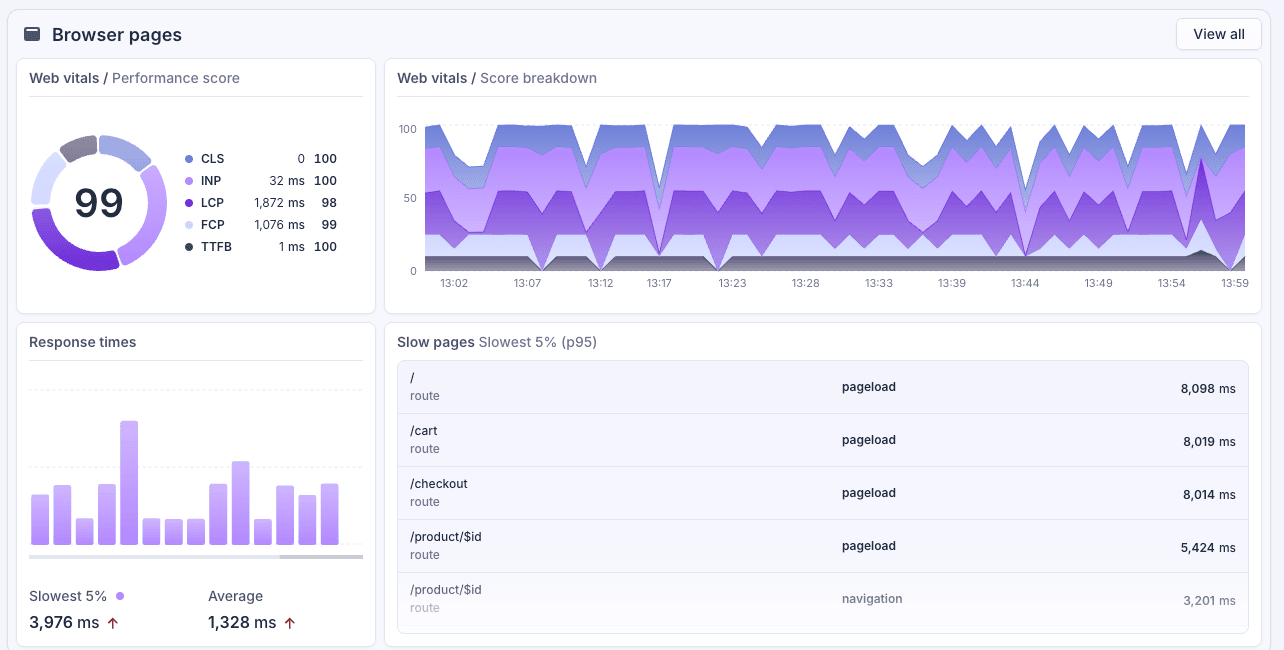
Both tiles merge every page load in that period and take the p75 per vital over all of them. They do not average the scores of your pages. So a page nobody visits does not pull the performance number down.
Performance score
The ring chart on the left holds the same score the Pages table shows per page, but now for the site as a whole. It should feel familiar to the one Lighthouse uses.
Every vital gets its own slice. The width of a slice is determined by the weight of its vital, so for example important metrics like LCP and INP each take up close to a third of the ring.
Missing vitals work the same as in the Pages table. A vital that was never measured shows - and the weight is spread over the others so the slices will adapt in their width. When less than half of the weight is present the ring shows --.
Score breakdown
The chart on the right is that same score, but over time. Each band is one vital, and the height of a band is what that vital contributed at that moment: its weight times its score. The bands stack up to the total score, which is why the axis stops at 100.
Hover the chart to read one moment: the total score, and what every vital contributed to it.
In the trace viewer
Open a single page load trace and you see the vitals for that one visit.
TTFB, FCP, and LCP appear as coloured chips on the page load bar, placed at the moment they happened. Each value is its own distance from the start of the page load, so the chip sits where the measurement landed on the timeline.
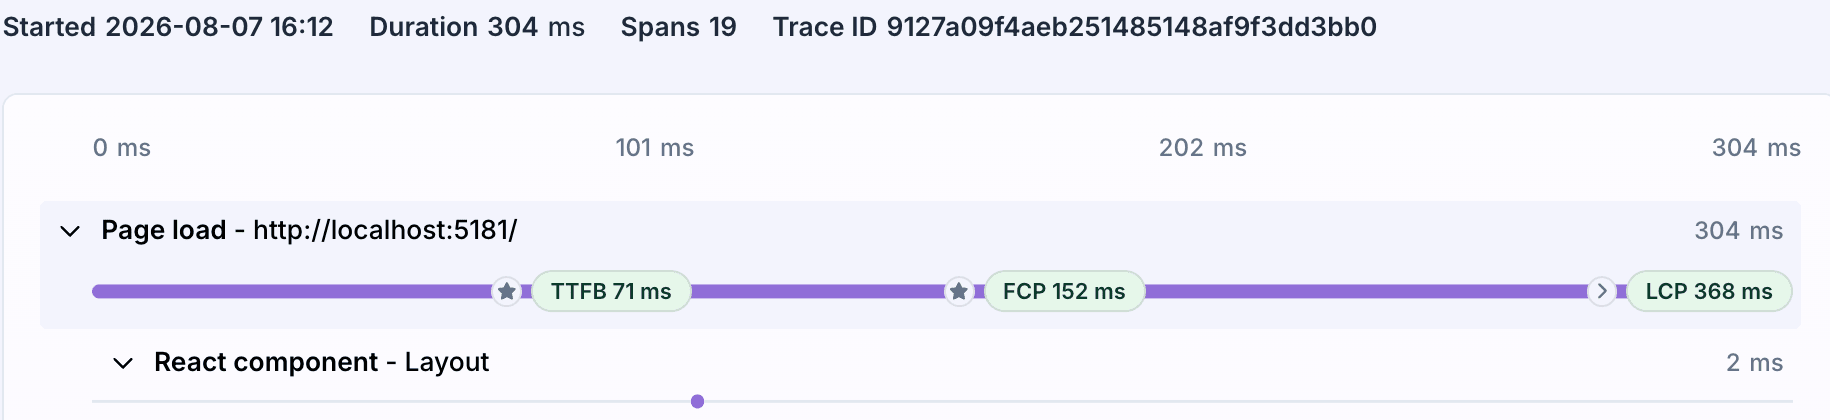
When a value falls past the right edge of the bar, its chip is pinned to the edge and marked with an arrow. An LCP that lands after the page load span closed still gets shown, rather than being pushed off screen.
INP and CLS get no chip. Neither of them describes a single moment: INP is one interaction somewhere in the visit and nothing records which one, and CLS adds up over the whole life of the page.
Select the page load span and the side panel shows a "Web vitals" section with all five, written out in full, with their unit and their colour.
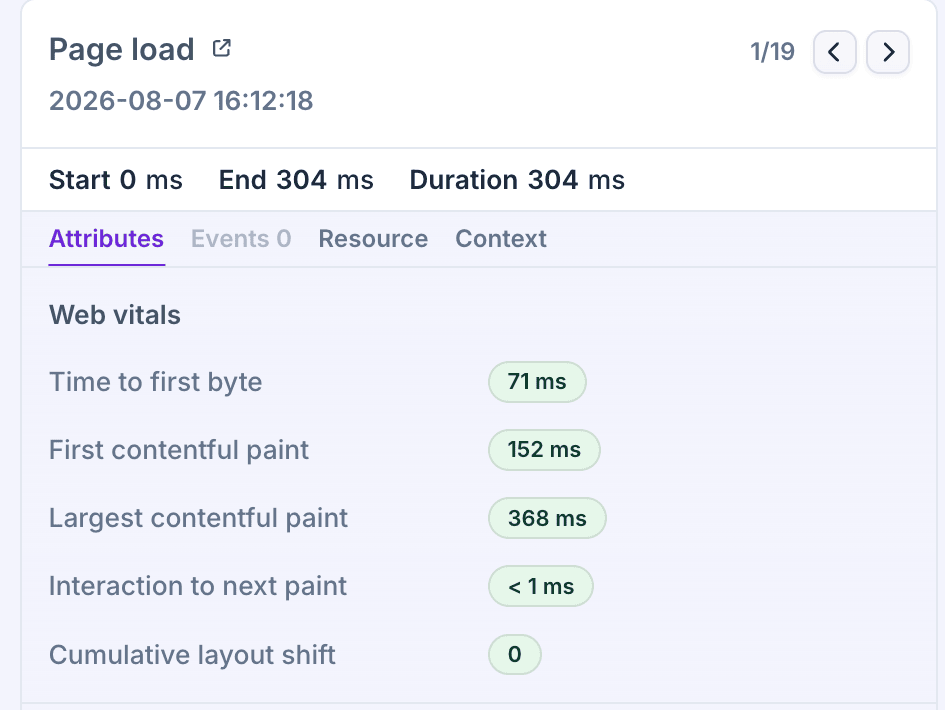
A vital the browser never measured is left out of this section rather than shown as zero. A CLS of 0 is a real result, so showing one for a browser that cannot measure CLS would read as a perfect page.
I'm missing some vitals?
If you open a trace right after a page load and you only see TTFB and FCP, that's normal. The other three are still being measured (LCP, CLS and INP).
The client sends them at the first client side route change, or when the visitor leaves, whichever comes first. Reload the trace after a few seconds and all five should be there.
The JS client sends them once and never updates them. On a normal site that means they cover the whole visit. In single page applications this only covers the initial pageload, so any navigation after that, does not record web vitals. This is by design, because clientside routing does not suffer from TTFB, FCP or LCP.
Where the numbers come from
Your visitors' browsers measure the vitals during a real visit, and the Flare JavaScript client sends them along with the page load trace. The values depend on the device, the connection, and the distance to your server, so they differ from what a testing tool reports on your own machine. You can compare the results to Google's Page Speed Index, but with a wider pool of devices.
Read web vitals in the JavaScript SDK for what the client does and which browser measures what.