Aggregate view
The aggregate view gives you detailed information about a single entry point, query, external HTTP call, or view within your project.
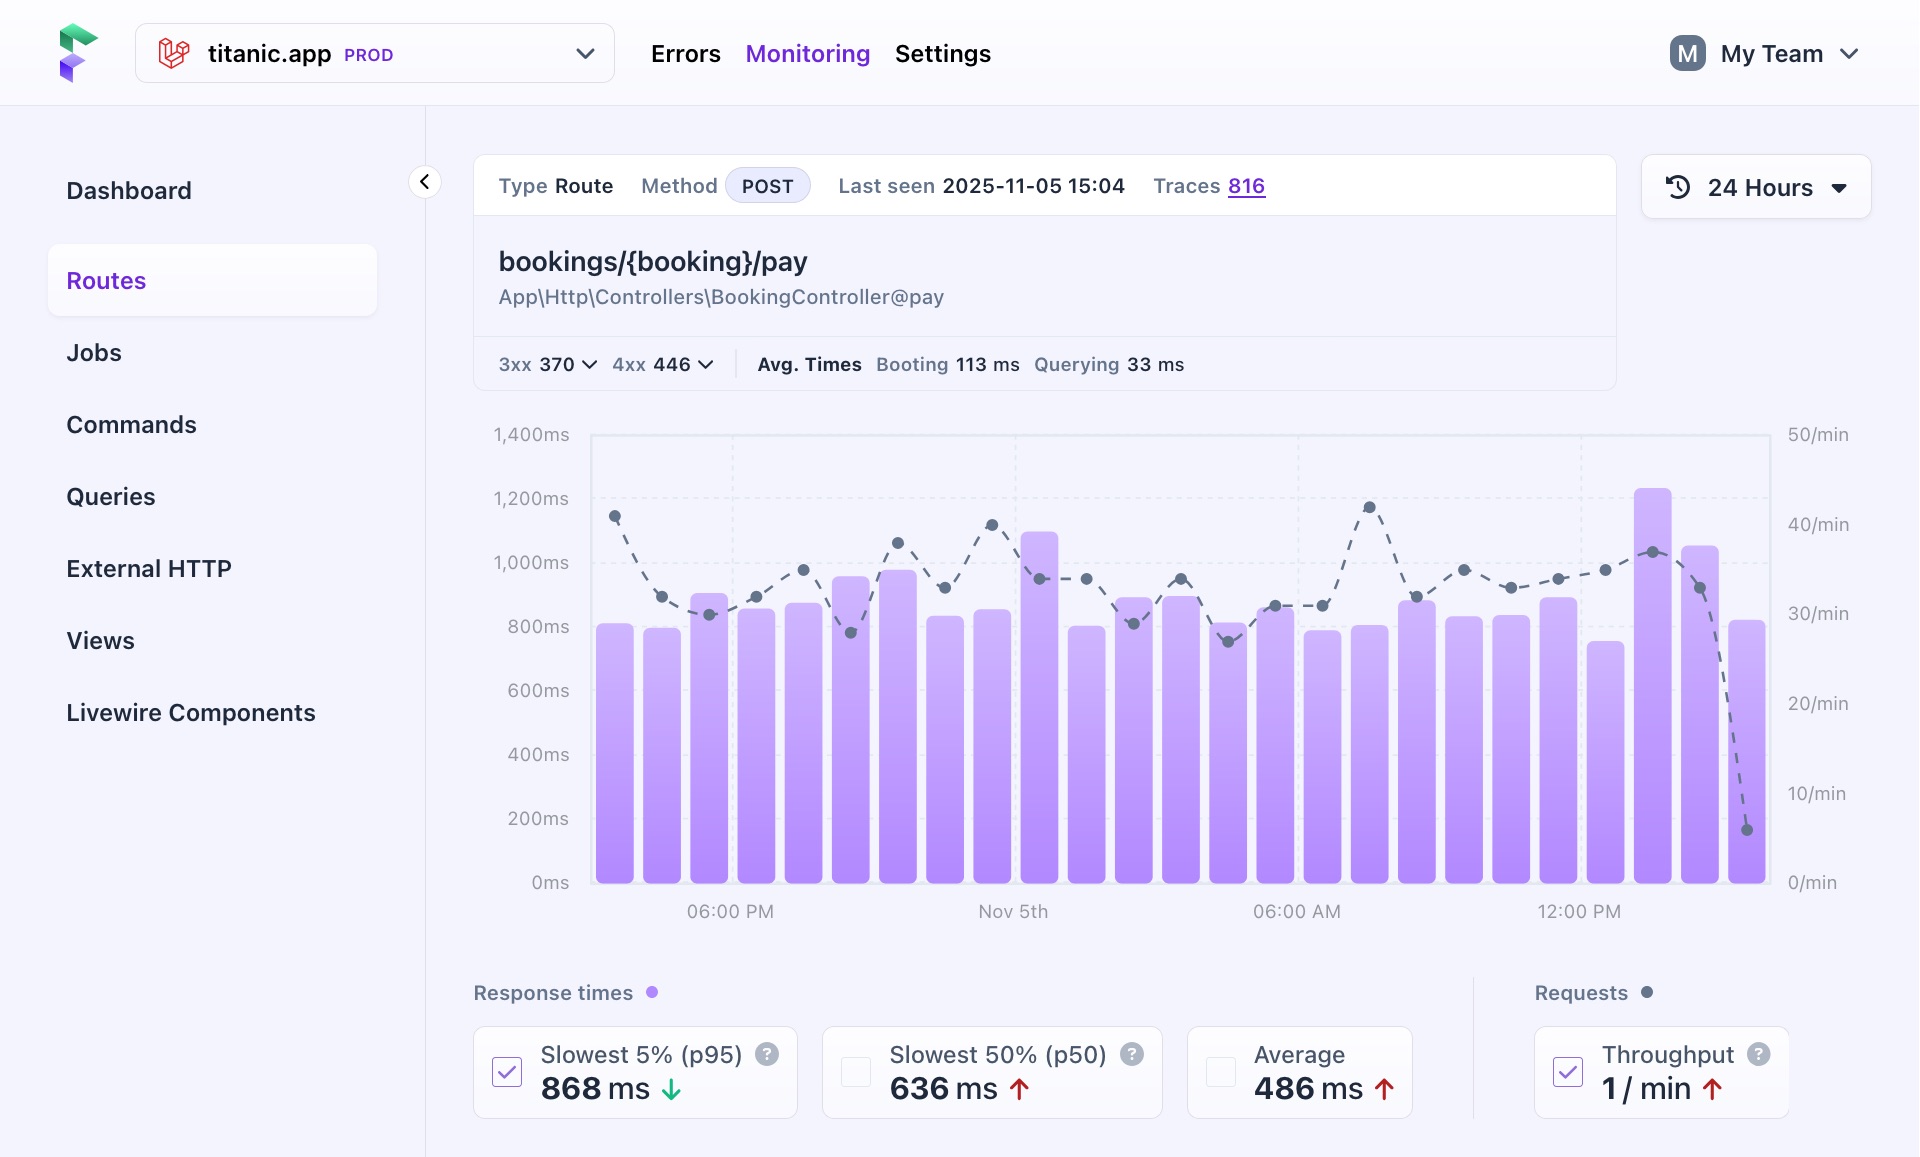
Each page has a header that varies depending on the type of entry, but generally includes:
- The entry type
- When it was last seen
- Its name or identifier
- Additional details like average cache times, boot times, and the number of jobs or queries run from that entry.
The graph and key metrics are also displayed here. They work in the same way as those on the overview page, but show data specific to the selected entry.
Breakdown & 'Appears in'
Below the graph, you’ll see either a ‘Breakdown’ or ‘Appears in’ section, depending on the aggregate:
- "Breakdown" is shown for routes, jobs, and commands, listing the queries, external HTTP calls, or commands they trigger.
- "Appears in" is shown for queries, external HTTP calls, and views, showing which routes, jobs, or commands triggered them.
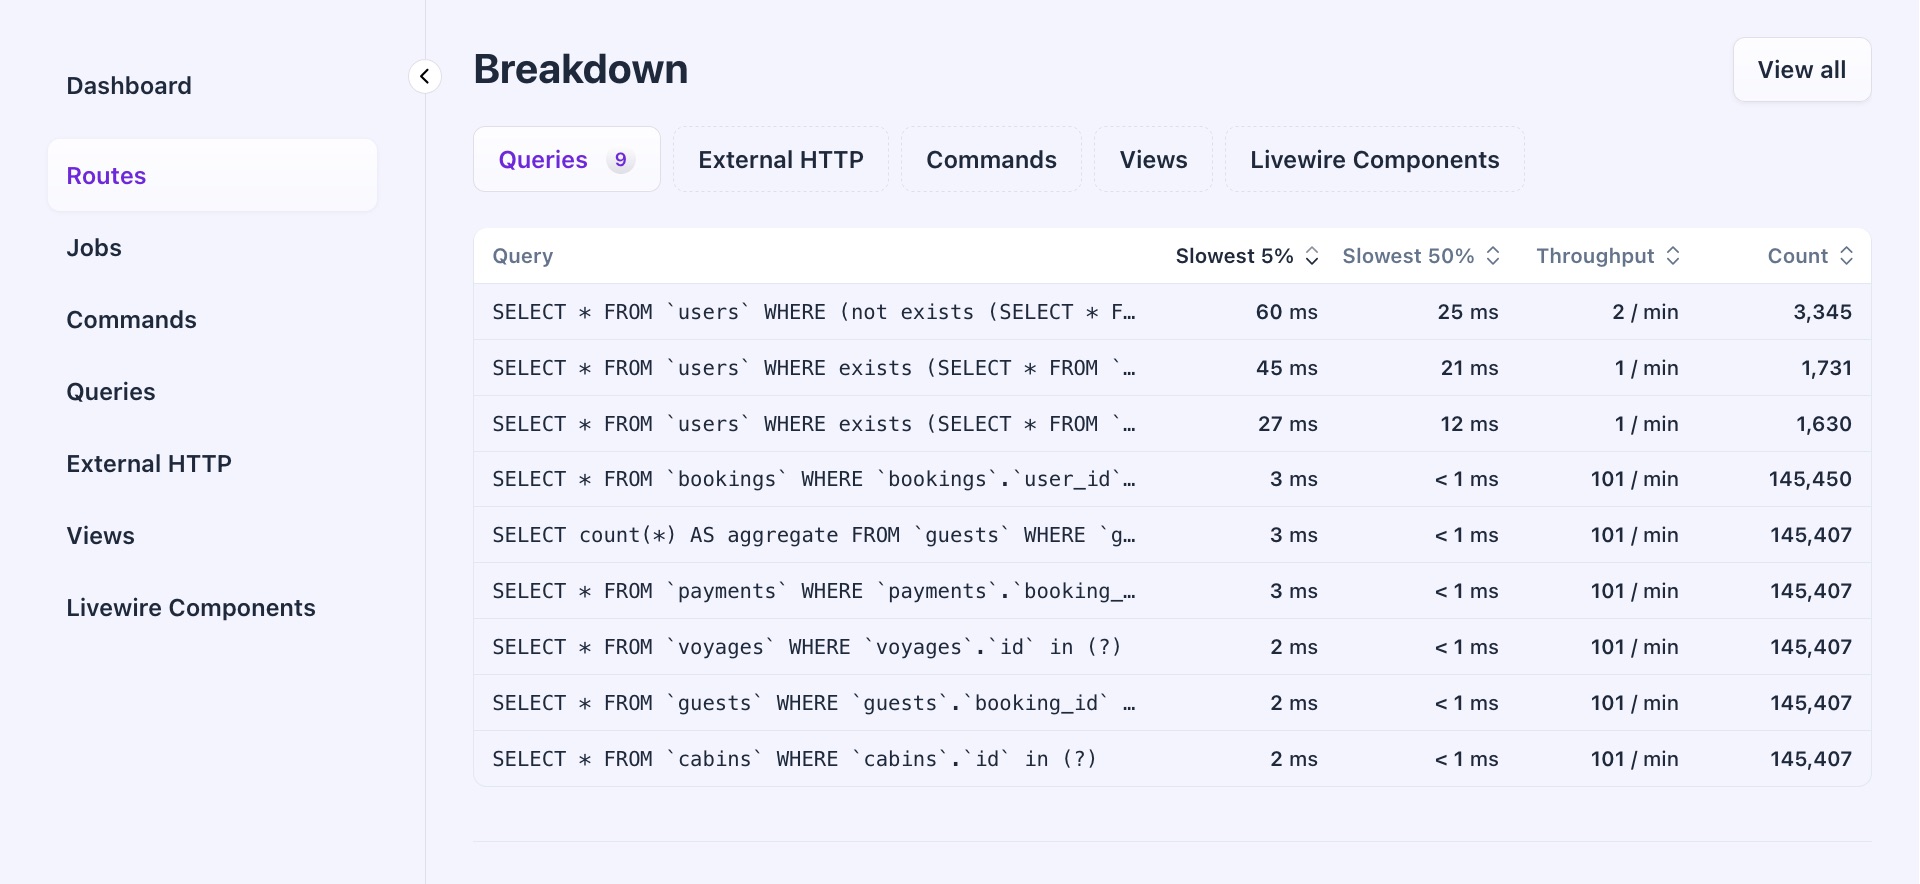
These tables are a powerful way to see how your entry points are linked to queries, external HTTP calls, and views (and vice versa). For example, they can help you understand why certain queries are called unexpectedly or identify jobs triggering slow external HTTP calls.
Trace timeline
A trace timeline can be found at the bottom of the page. A timeline like this shows you a single request as it moves through your project and the time it took. This is the trace, and all data used for performance monitoring comes from these traces.
A trace is made up of spans that break down the tasks into individual ‘tasks’ performed by a request, task, query, or other origin in your project. These ‘tasks’ can be queries, external HTTP calls, but also boot time and running Laravel and PHP on your server.
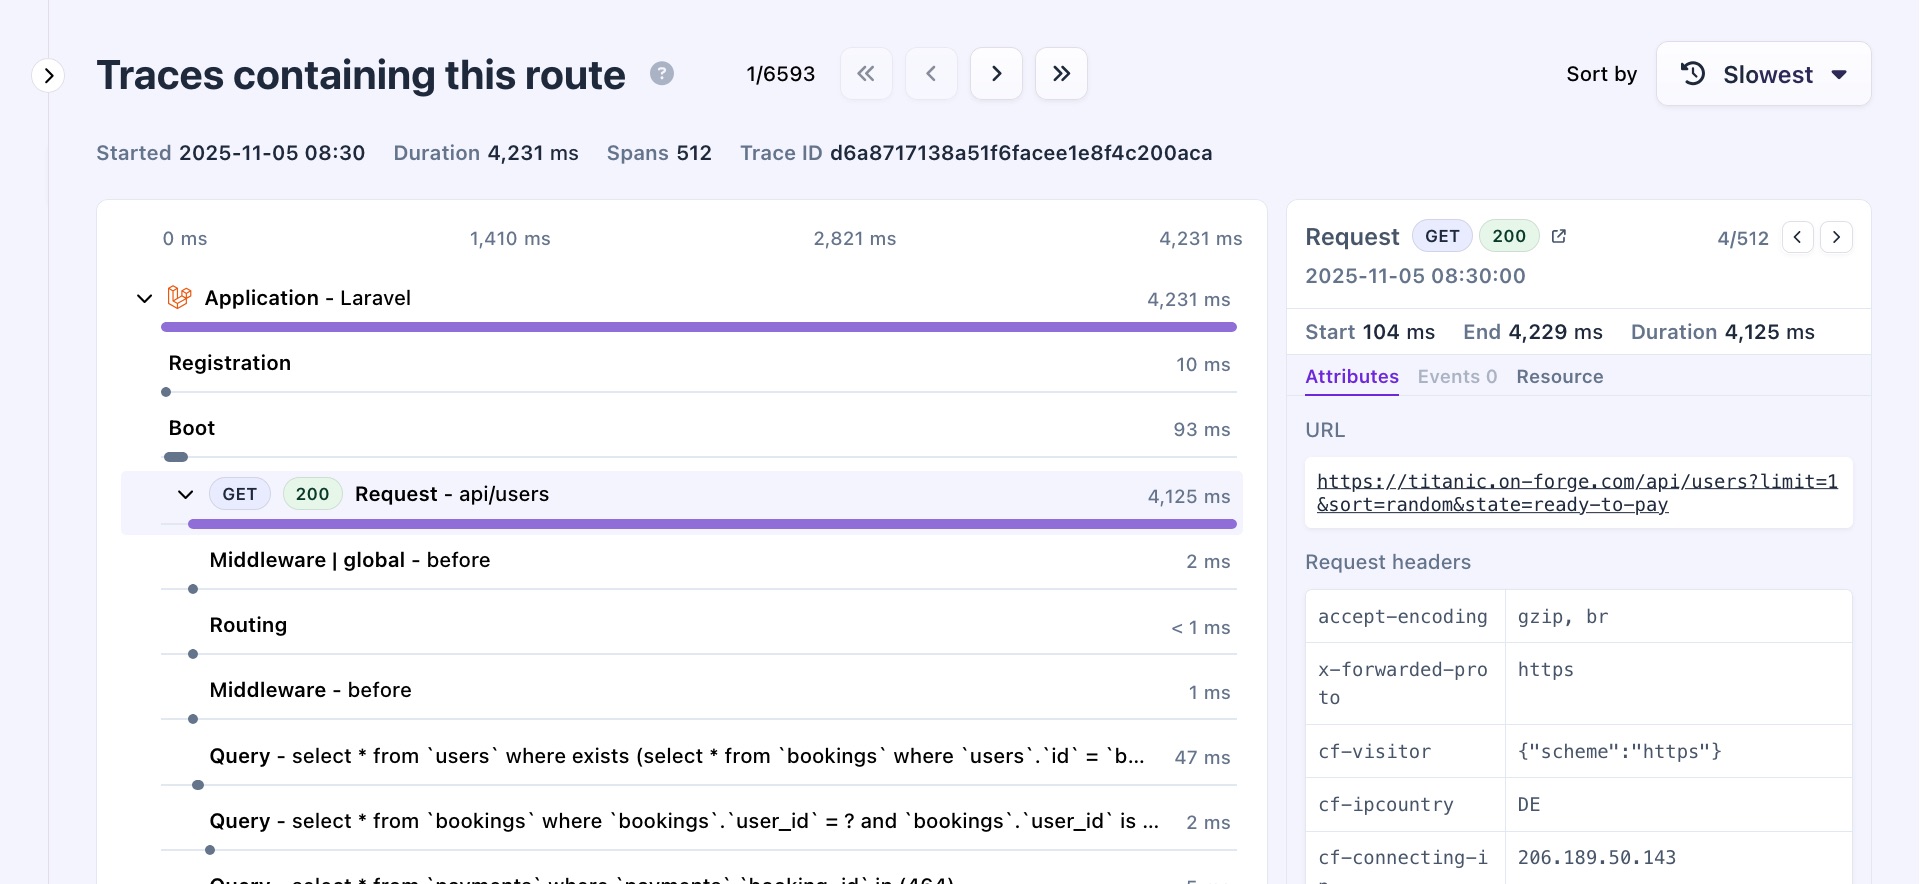
The slowest traces are listed first. These outliers represent the "worst cases" and can help you find performance issues. You can also sort by most recent, oldest, or fastest traces.
On this page