Working with traces
A trace shows you the details of a single request as it moves through your app. They give you insight into individual requests, unlike aggregate data that is based on all requests. But traces don’t always show the full picture as performance issues often come from multiple areas, not just one request.
Focus too much on traces, you might miss bigger problems affecting performance.
However, there are some situations where looking at individual traces can be helpful:
- Understanding bottlenecks by being able to see where your code is spending most of its time.
- Revealing specific queries that take longer than expected, pointing to underlying issues with that query.
- Requests with many short-running queries may have n+1 queries that can be optimized.
Some of this information can also be found using the aggregated data in the "Breakdown" or "Appears in" sections of your entry points, Queries, External HTTP calls and Views.
Types of spans
The spans you come across in the trace timeline may depend on the type of data you are looking at. These are the ones to keep an eye out for:
- App, Registering, Boot, Routing, Termination
- Request, Job, Command
- Queries
- Transactions
- Queueing
- View
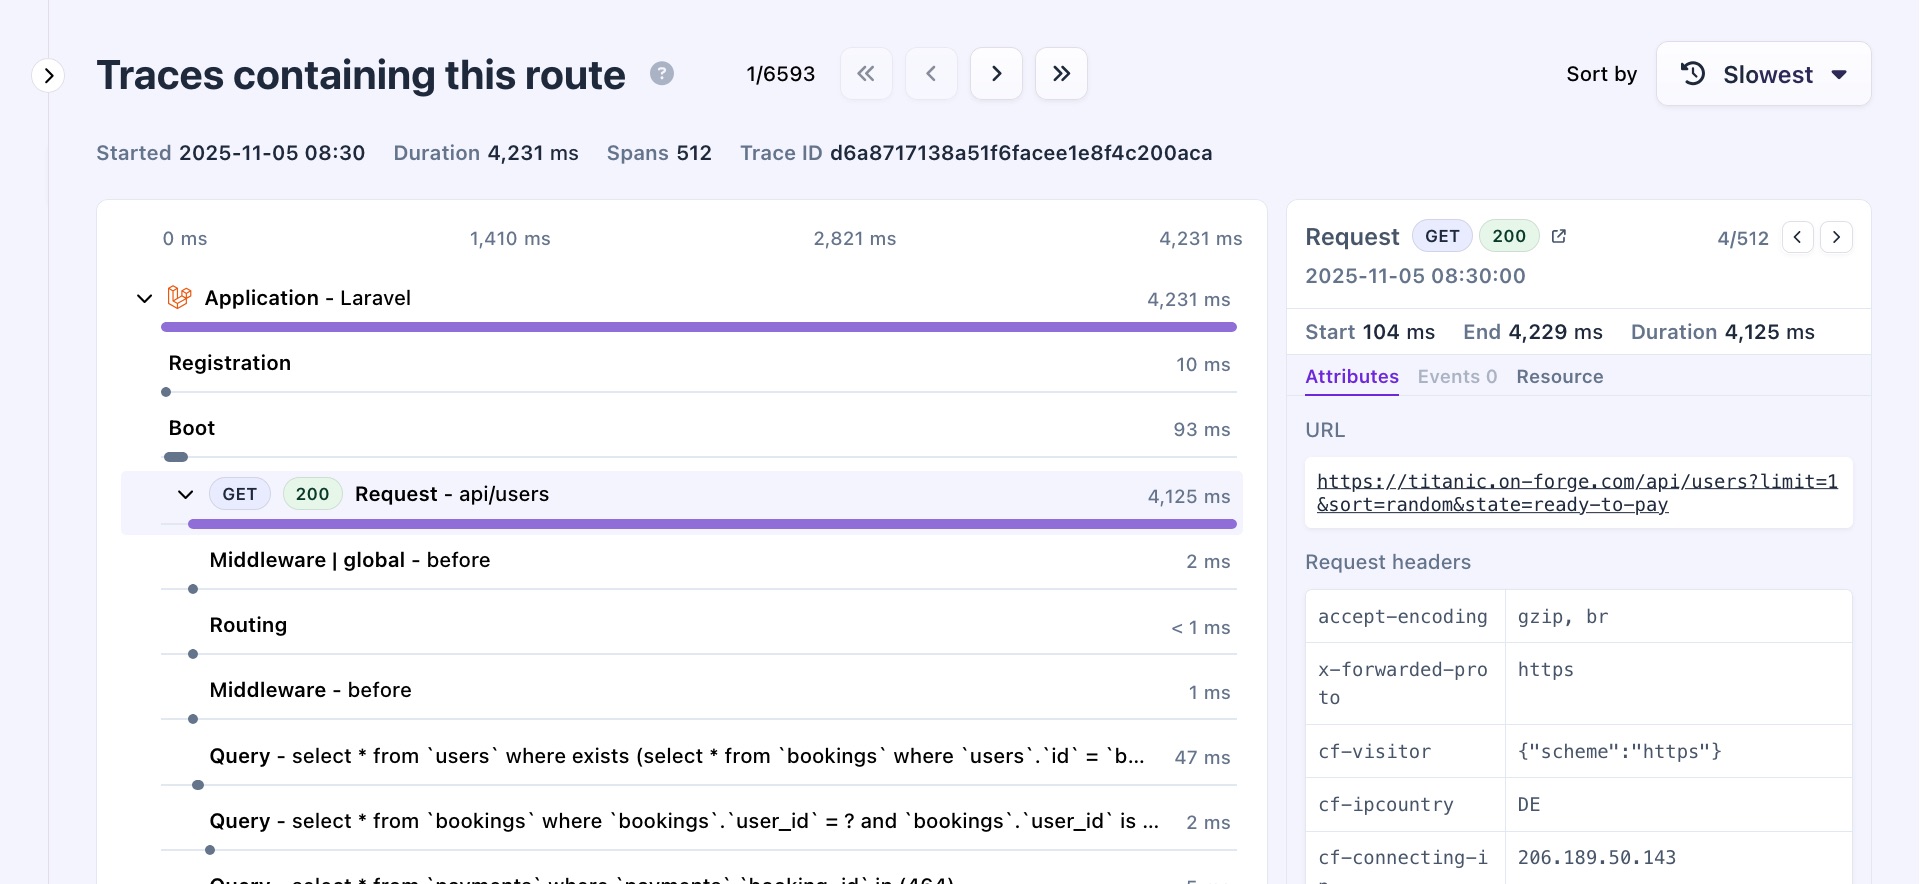
Each span is mapped on a timeline starting from 0ms. Purple bars indicate the full lifecycle of the trace, while dark grey bars show the span's processing time.
Selecting a span shows more information about it, including:
- What type it is
- Duration and start/end times
- Any attributes on the span (depending on the type)
- Any events that were fired during the span's lifecycle
- Information about the server/service that processed the trace/span
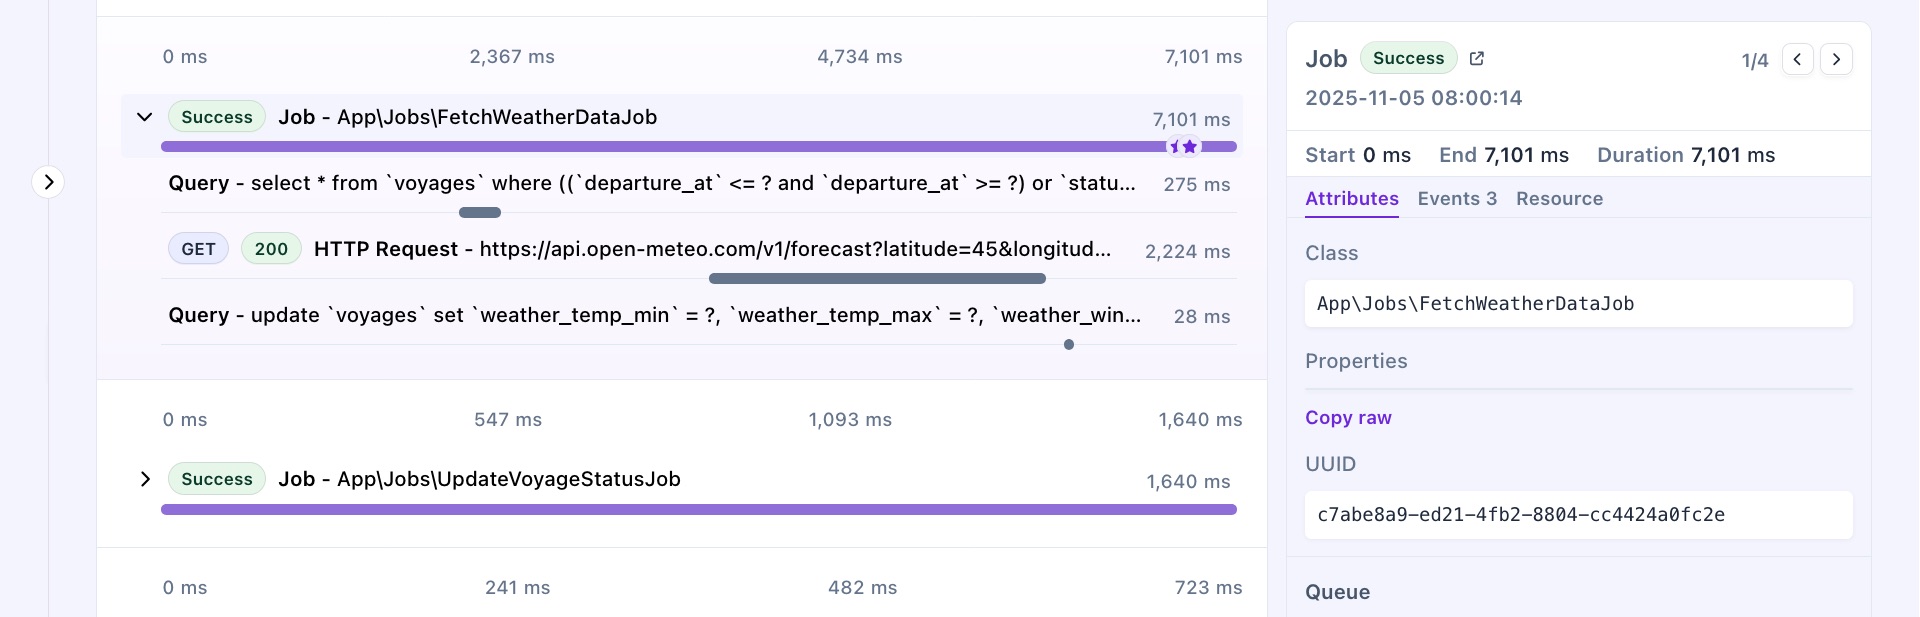
(Multiple) Jobs
In some cases, the trace timeline may show multiple jobs. This could mean that one job queued another, or that a command executed a job and Flare continued tracing until the final job in the chain was completed.
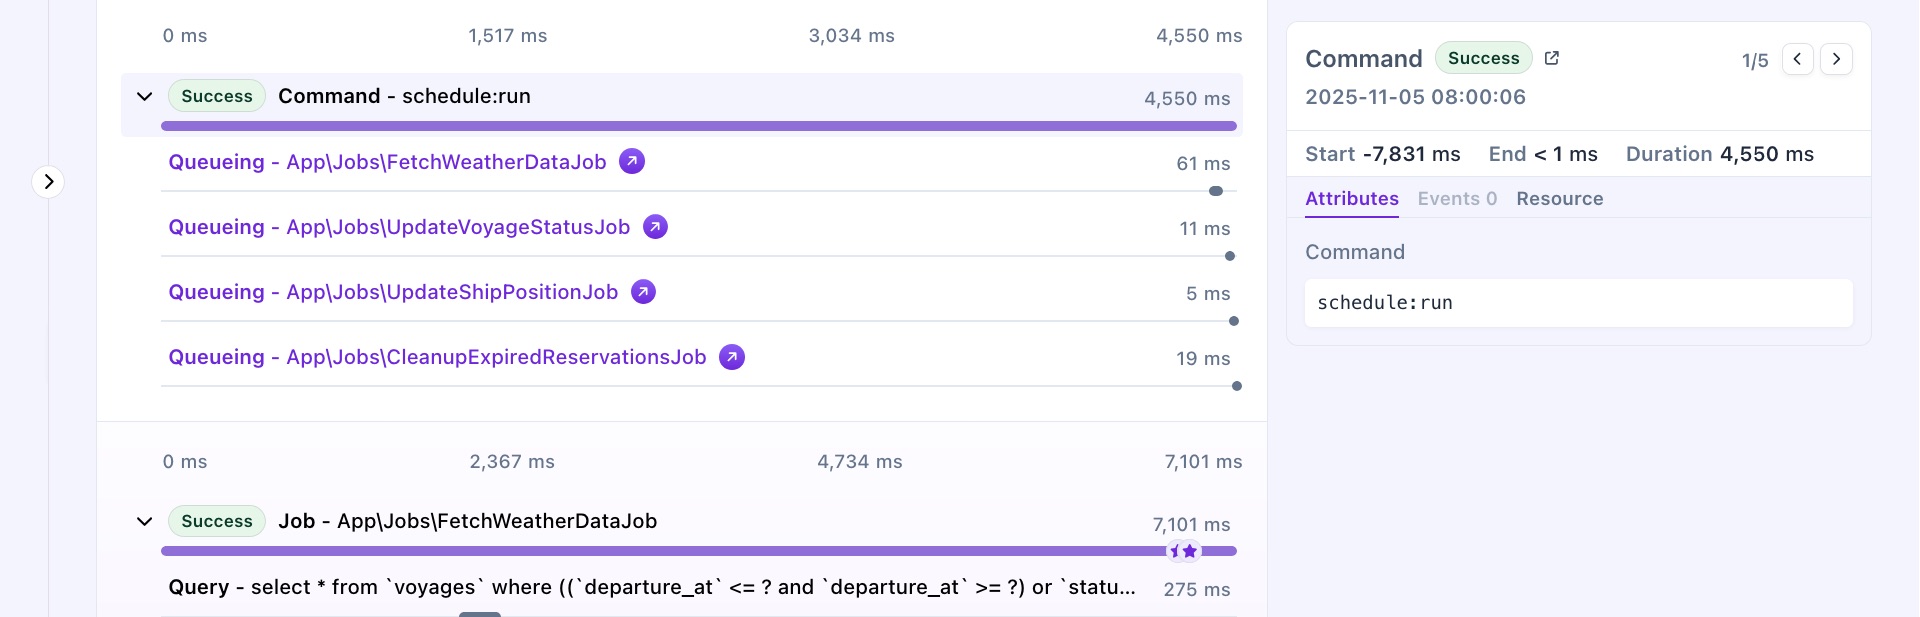
In this example, we’re inspecting the job App\Jobs\FetchWeatherDataJob. This job was scheduled by a command that triggered four separate jobs. All four appear in the trace because they were executed within the same span, and Flare displays them together. The original job being inspected is highlighted to make it stand out from the others.
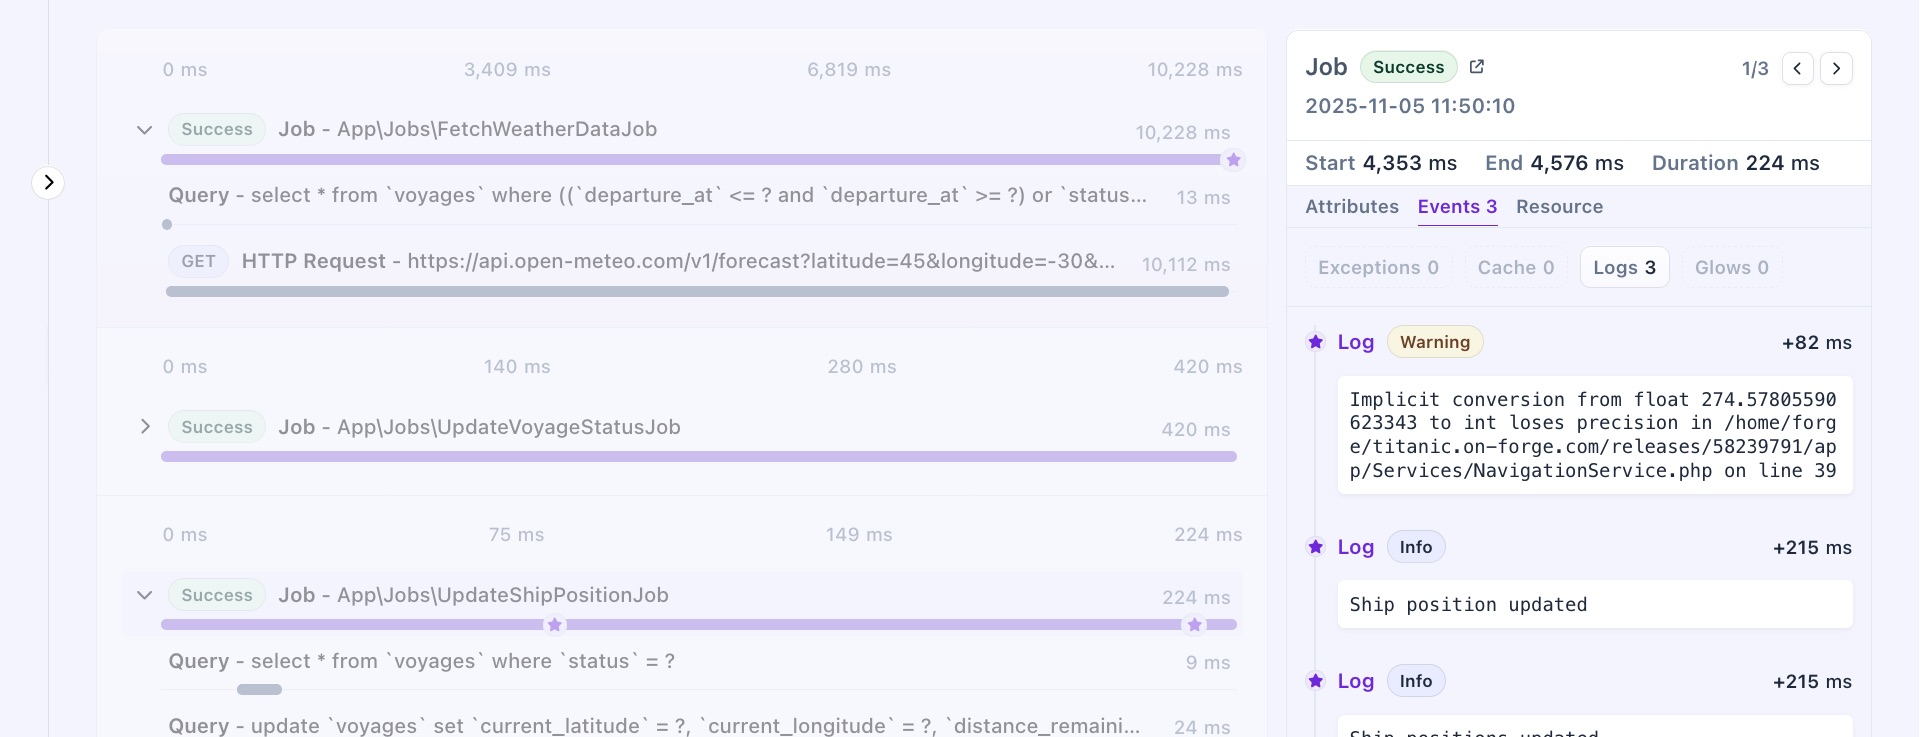
Types of events
Events are actions that happened during a span, and can be triggered automatically by your application, or something custom you defined to trigger.
Events may include custom information, cache hits/misses, or exceptions. Exceptions are marked with a red exclamation on the span timeline.
We collect these types of events:
- Exceptions: triggered when an error occurs (ex., a request returning a
500status code). - Cache: captures cache operations, including set, hit, miss, and forget events.
- Logs: records log entries from your application, with optional priority levels.
- Glows: Laravel-specific log entries, functionally similar to standard logs.
On this page